Unlock a world of possibilities! Login now and discover the exclusive benefits awaiting you.
- Qlik Community
- :
- All Forums
- :
- QlikView App Dev
- :
- accumulation in pivot table
- Subscribe to RSS Feed
- Mark Topic as New
- Mark Topic as Read
- Float this Topic for Current User
- Bookmark
- Subscribe
- Mute
- Printer Friendly Page
- Mark as New
- Bookmark
- Subscribe
- Mute
- Subscribe to RSS Feed
- Permalink
- Report Inappropriate Content
accumulation in pivot table
i have three dimensions
YEAR / MONTH / INVENTLOCATION
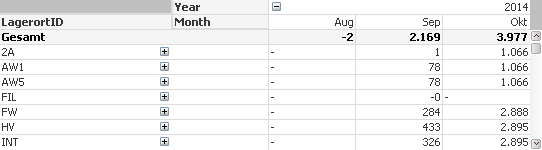
This is my formel
rangesum(above(sum(POSTEDVALUE), 0 , ColumnNo()))/1000
my problem is that the columns are not added, the net problem is when i get a solutionn fpr this can i use it from the beginning over mor than 1 year??
Can someone help ?
Thanx
- Mark as New
- Bookmark
- Subscribe
- Mute
- Subscribe to RSS Feed
- Permalink
- Report Inappropriate Content
Provide sample data please
- Mark as New
- Bookmark
- Subscribe
- Mute
- Subscribe to RSS Feed
- Permalink
- Report Inappropriate Content
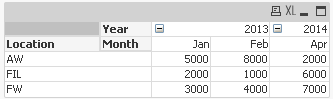
Location, Date, Value
AW, 15.01.2013, 5000
FW, 13.01.2013, 3000
FIL, 20.01.2013, 2000
AW, 15.02.2013, 8000
FW, 13.02.2013, 4000
FIL, 20.02.2013, 1000
........
AW, 15.04.2014, 2000
FW, 13.04.2014, 7000
FIL, 20.04.2014, 6000
result:
2013 2014
Jan Feb Apr
AW 5000 13000 15000
FW 3000 7000 14000
FIL 2000 3000 9000
- Mark as New
- Bookmark
- Subscribe
- Mute
- Subscribe to RSS Feed
- Permalink
- Report Inappropriate Content
Use below in your script...
Temp:
Load
*,
Month(Date#(Date,'DD.MM.YYYY')) as Month,
Year(Date#(Date,'DD.MM.YYYY')) as Year Inline
[
Location, Date, Value
AW, 15.01.2013, 5000
FW, 13.01.2013, 3000
FIL, 20.01.2013, 2000
AW, 15.02.2013, 8000
FW, 13.02.2013, 4000
FIL, 20.02.2013, 1000
AW, 15.04.2014, 2000
FW, 13.04.2014, 7000
FIL, 20.04.2014, 6000
];
Load
Location,
Month,
Year,
IF(Location = Previous(Location), RangeSum(Peek(TotalValue),Value),Value) as TotalValue
Resident Temp
Order By Location, Year, Month;
Now create a Pivot Table
Dimension
Location
Month
Year
Expression
SUM(TotalValue)
Adjust Month as Year by dragging as per your requirements...
- Mark as New
- Bookmark
- Subscribe
- Mute
- Subscribe to RSS Feed
- Permalink
- Report Inappropriate Content
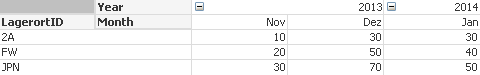
Hi,
To getting data like mention load your table
Source:
Load
Month(Date#(Date,'DD.MM.YYYY')) as Month,
Year(Date#(Date,'DD.MM.YYYY')) as Year,
Location, Date, Value Inline
[ Location, Date, Value
AW, 15.01.2013, 5000
FW, 13.01.2013, 3000
FIL, 20.01.2013, 2000
AW, 15.02.2013, 8000
FW, 13.02.2013, 4000
FIL, 20.02.2013, 1000
AW, 15.04.2014, 2000
FW, 13.04.2014, 7000
FIL, 20.04.2014, 6000 ];
And then create the pivot table
Dim1:- Location
Dim2:- Year
Dim3:- Month
Expression:- Sum(Value)
But you need to drag the fields Year and Month top right corner to the up side and then you get chart as
Regards
Anand
- Mark as New
- Bookmark
- Subscribe
- Mute
- Subscribe to RSS Feed
- Permalink
- Report Inappropriate Content
Thats my solution
=rangesum(before(sum(POSTEDVALUE),0,ColumnNo()))/1000
- Mark as New
- Bookmark
- Subscribe
- Mute
- Subscribe to RSS Feed
- Permalink
- Report Inappropriate Content
I don't think so this is what you are looking for after comparing your result from your data and the above expression you have posted...
i.e. as per your example, you want 2014 and 2013 should be accumulated but as per above expression, it will not...
let me know if I am wrong....
- Mark as New
- Bookmark
- Subscribe
- Mute
- Subscribe to RSS Feed
- Permalink
- Report Inappropriate Content
u are right it doesnt work
my new example said
SCRIPT:
LOAD LagerortID,
POSTEDVALUE,
MODIEFIEDDATE,
Year(MODIEFIEDDATE) AS Year,
Month(MODIEFIEDDATE) AS Month
FROM
*******
values

Pivot
can u explain me exact what i can do to solve the problem??
- Mark as New
- Bookmark
- Subscribe
- Mute
- Subscribe to RSS Feed
- Permalink
- Report Inappropriate Content
have you tried my example of scripting?
- Mark as New
- Bookmark
- Subscribe
- Mute
- Subscribe to RSS Feed
- Permalink
- Report Inappropriate Content
LOAD
POSTEDVALUE,
INVENTDIMID,
MODIFIEDDATETIME,
Year (MODIFIEDDATETIME) AS Year,
Month(MODIFIEDDATETIME) AS Month,
Date(monthstart(MODIFIEDDATETIME,), 'MM-YYYY') as MonthYear
FROM
(qvd);
LOAD INVENTDIMID,
INVENTLOCATIONID
FROM
(qvd);
LOAD INVENTLOCATIONID,
NAME AS IVENTLOCATION_NAME,
INVENTLOCATIONIDREQMAIN,
INVENTSITEID
FROM
(qvd);
look at my reall script can u explain for this what i have to do...
i dont really understand in your example where i have to do these things
thanx