Unlock a world of possibilities! Login now and discover the exclusive benefits awaiting you.
- Qlik Community
- :
- All Forums
- :
- QlikView App Dev
- :
- Run off/ Formulas/ Aggr
- Subscribe to RSS Feed
- Mark Topic as New
- Mark Topic as Read
- Float this Topic for Current User
- Bookmark
- Subscribe
- Mute
- Printer Friendly Page
- Mark as New
- Bookmark
- Subscribe
- Mute
- Subscribe to RSS Feed
- Permalink
- Report Inappropriate Content
Run off/ Formulas/ Aggr
Hi All
I have a problem and i need some help.
I have a graph which shows me the Full accumulation of payments over a year month on month.
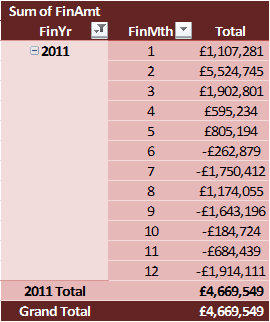
Below is the graph which is aggr and the table which shows payments over the month.
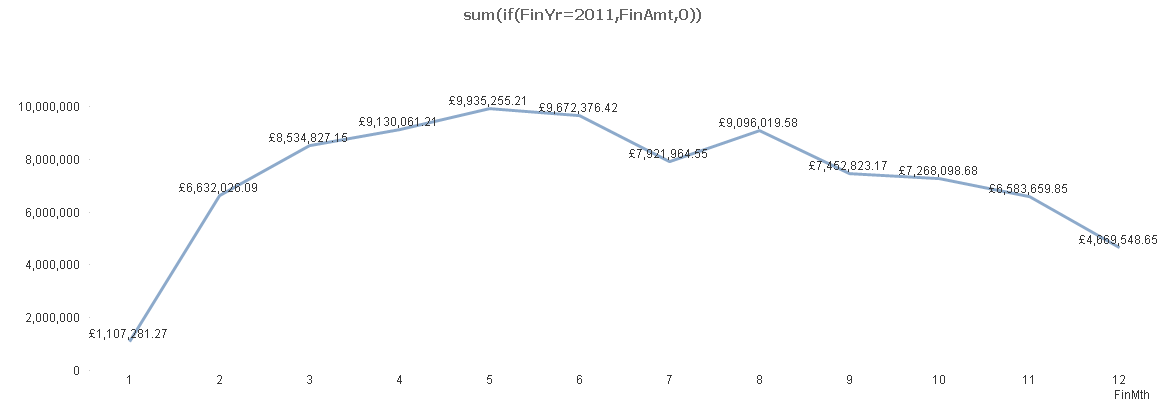
The above is all working.
Now i want to divide each months figures by the Aggr payments as at Dec 2010.
The figure is £90,561,496.
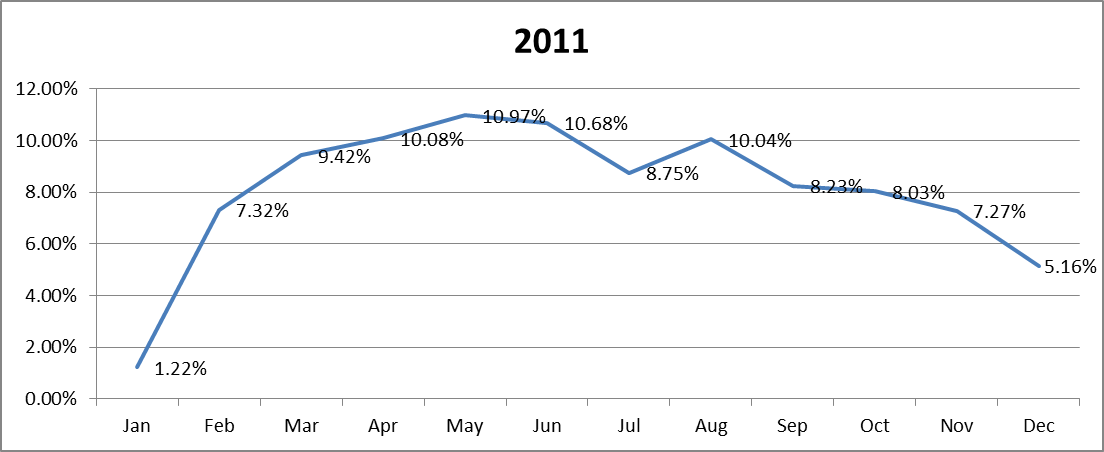
I want to find out the % difference month on month from Dec 2010
So in excel it looks like this and plots on a graph like this.
| PY End Incurred | Jan | Feb | Mar | Apr | May | Jun | Jul | Aug | Sep | Oct | Nov | Dec |
| £90,561,496 | £1,107,281 | £6,632,026 | £8,534,827 | £9,130,061 | £9,935,255 | £9,672,376 | £7,921,965 | £9,096,020 | £7,452,823 | £7,268,099 | £6,583,660 | £4,669,549 |
| 1.22% | 7.32% | 9.42% | 10.08% | 10.97% | 10.68% | 8.75% | 10.04% | 8.23% | 8.03% | 7.27% | 5.16% | |
| =D47/$C$47 | =D47/$C$48 | =D47/$C$49 | =D47/$C$50 | =D47/$C$51 | =D47/$C$52 | =D47/$C$53 | =D47/$C$54 | =D47/$C$55 | =D47/$C$56 | =D47/$C$57 | =D47/$C$58 |
Now I got the £90,561,496 by taking it from a list of payments which is the sum of all the payment amounts in the sheet
| ID | Payment Amount |
| 803148-G | 5812900 |
| 834398-G | 3500000 |
| 669429-G | 3480580 |
| 733840-G | 3180981 |
| 726830-G | 2500000 |
| 573898-G | 2306836 |
| 169199-G | 2069818 |
| 733465-G | 2018582 |
| 409757-G | 1941109 |
| 708244-G | 1833551 |
| 593357-G | 1743031 |
| 643704-G | 1666102 |
| 682705-G | 1343976 |
| 478096-G | 1313042 |
| 439997-G | 1310626 |
So my thoughts would be that i would write a separate expression to sum the above to get the £90,561,496 then dived the two expressions by each other.
But when i do this it doesn't plot on the graph correct.
Here is my formula
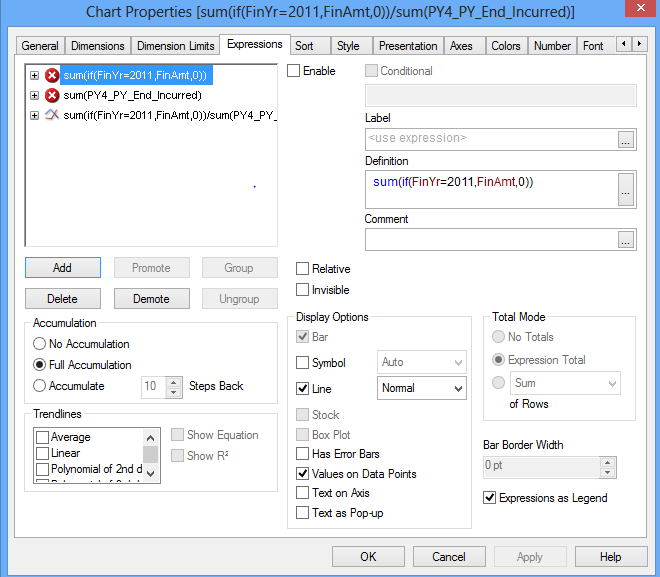
Can anyone help...
- Mark as New
- Bookmark
- Subscribe
- Mute
- Subscribe to RSS Feed
- Permalink
- Report Inappropriate Content
Hi Andrew,
try with this formula instead:
=Aggr(sum({$ <FinYr={2011}>} FinAmt), FinMth) / sum(PY4_PY_End_Incurred)
and let me know if it works.
Giacomo