Unlock a world of possibilities! Login now and discover the exclusive benefits awaiting you.
- Qlik Community
- :
- Forums
- :
- Groups
- :
- Industry and Topics
- :
- Healthcare
- :
- Bivariate Mapping
- Subscribe to RSS Feed
- Mark Topic as New
- Mark Topic as Read
- Float this Topic for Current User
- Bookmark
- Subscribe
- Mute
- Printer Friendly Page
- Feature this Topic
- Mark as New
- Bookmark
- Subscribe
- Mute
- Subscribe to RSS Feed
- Permalink
- Report Inappropriate Content
Bivariate Mapping
I was recently asked to put something together for a Qlik GeoAnalytics for QlikView workshop for Qonnections. After having already done so many Qlik GeoAnalytics demo's I was ECSTATIC that the session was QlikView instead of Qlik Sense.
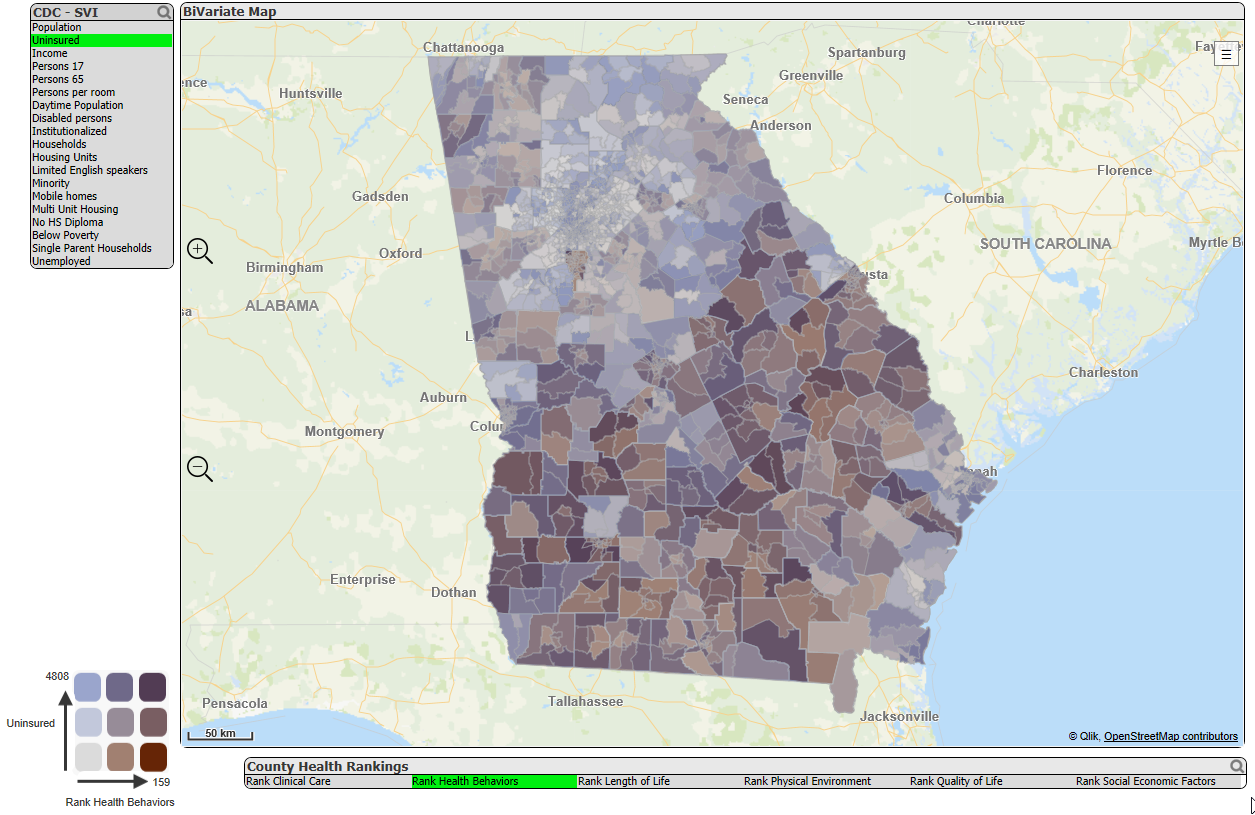
I know that seems odd. But here was my thinking ... I've always wanted to ROCK a bivariate map (coloring for 2 different measures) but the problem is the end user. Users can understand the variance from grey to blue or grey to brown but what in the world is a mid purple? Really ROCKING it involves the user actually understanding it and that requires a matrix type legend.
Gittyup! That's what QlikView helps you do really well. Squeeze a lot into very little space.
Bazinga! QlikView allows you to hide the mapping layers so end user focus is on the map and the insights.
The attached ZIP file contains the complete step by step instructions to help you build an application that can produce what is contained in this image.
PS - Everything
- Mark as New
- Bookmark
- Subscribe
- Mute
- Subscribe to RSS Feed
- Permalink
- Report Inappropriate Content
Wow! Really great example of Thematic Mapping in QlikView. Something that could only be done with higher end ESRI products just a few years ago! Great work!