Unlock a world of possibilities! Login now and discover the exclusive benefits awaiting you.
- Qlik Community
- :
- Forums
- :
- Groups
- :
- Industry and Topics
- :
- Healthcare
- :
- To achieve, or not to achieve action. That is the ...
- Subscribe to RSS Feed
- Mark Topic as New
- Mark Topic as Read
- Float this Topic for Current User
- Bookmark
- Subscribe
- Mute
- Printer Friendly Page
- Feature this Topic
- Mark as New
- Bookmark
- Subscribe
- Mute
- Subscribe to RSS Feed
- Permalink
- Report Inappropriate Content
To achieve, or not to achieve action. That is the question.

Portrait of William Shakespeare
At least it’s the question that we in the business intelligence community should be focusing on. Why weave my title so closely to one of the most famous lines by William Shakespeare?
Simple. Our ability to drive actionable intelligence relies heavily on our ability to weave a story around the data insights that we have discovered.
Discovering that we have 10 serious issues in our company and having $5 in your pocket will get you a cup of coffee at Starbucks. But being able to share the information about even 1 of those issues in a way that leads to actual change will put such a spring in your step that coffee will be unneeded.
In her fantastic book “Storytelling with Data” author Cole Nussbaumer Knaflic introduces two great phrases which really brought about great clarification to me. Exploratory Analysis vs Explanatory Analysis.
Exploratory Analysis are the actions that we take to do data discovery. It’s the drilling around. Poking under the hood. Using our human intuition to question the data. And the lights that dawn as a result.
Explanatory Analysis on the other hand is the art of being able to use the data to communicate a story that helps induce actions from those that have the power to make them. It involves our ability to use one of the oldest forms of human communication, storytelling, that has sadly become a lost art.
Emotional Call to Action
Storytelling can involve some very in your face kind of messages as a way to ensure that leadership has a call to action. For example imagine that we’ve spent a few days consuming clinical and financial data using a dashboard similar to the following that has multiple linked screens that we utilized to find an issue with a particular set of selections.
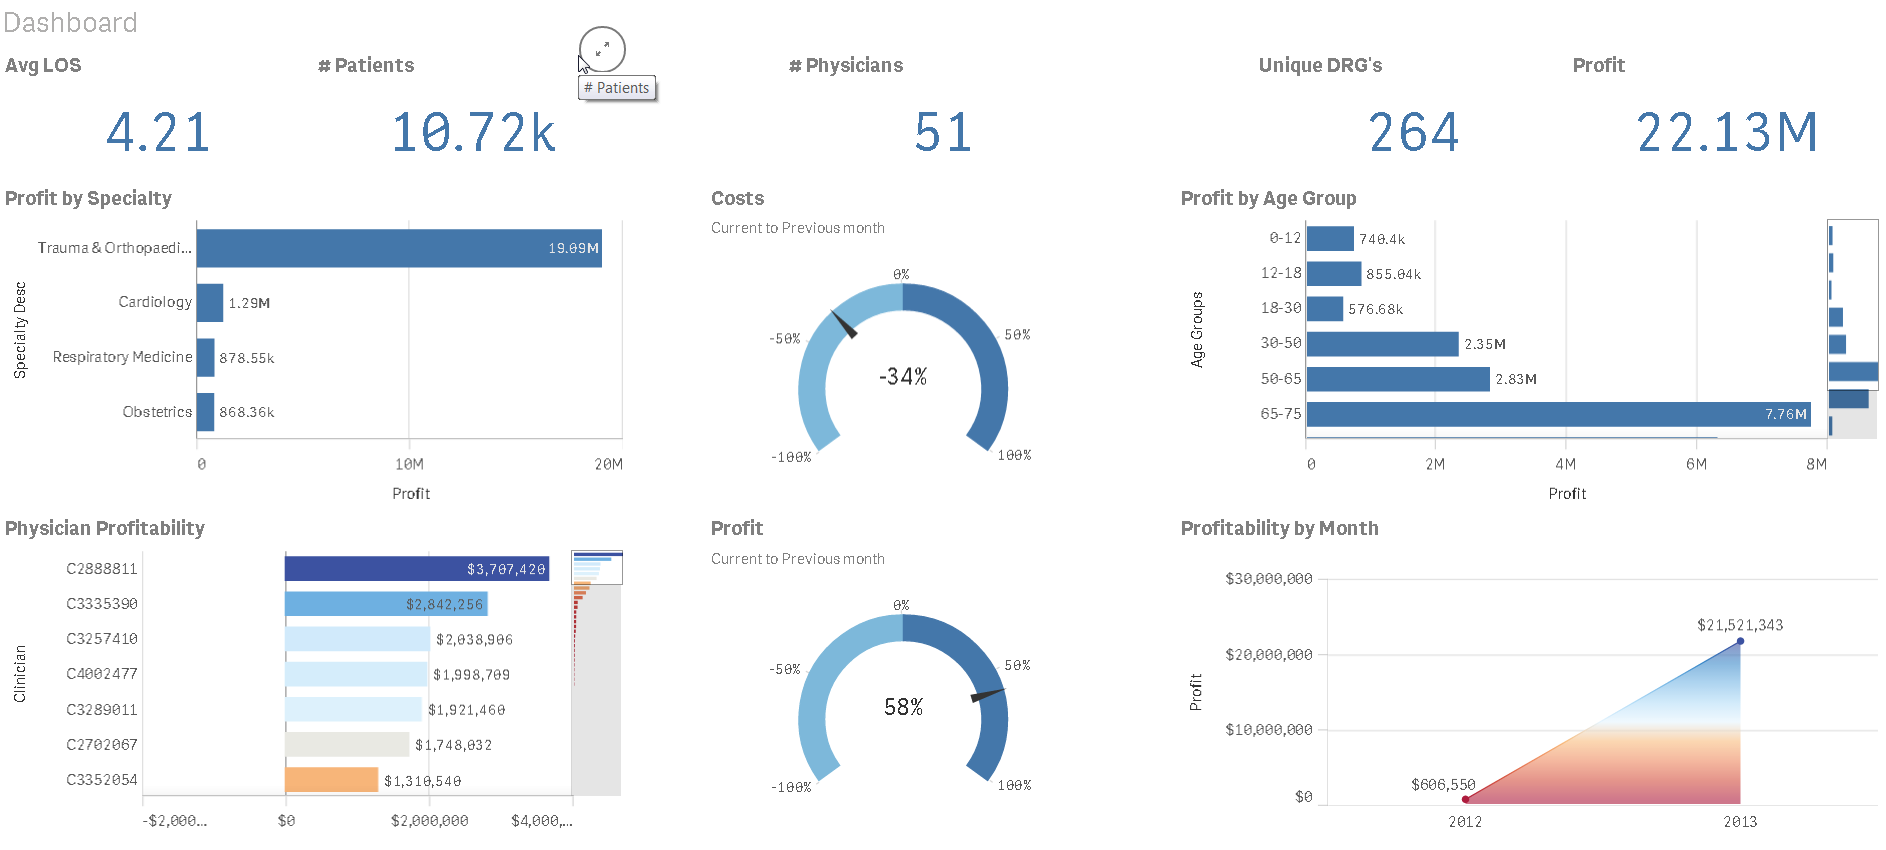
We could hold a meeting and put leadership to sleep showing them how cool our ability to navigate is or we can simply lead with a slide like the following that grabs attention.
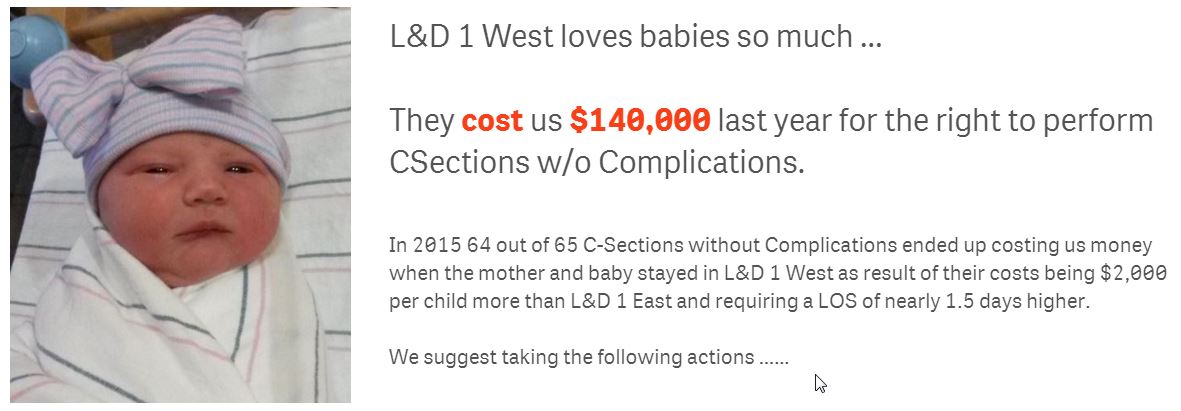
You probably don’t want to use humorous sarcasm in your presentation to point the finger at a group but I think it works for this post as you kind of expect it from me. The slide includes enough details to insight some action and by all means include the actions you want to see taken. Of course you may have to prove your details and that’s exactly why the Storytelling feature in Qlik Sense is so valuable you can jump in and out of your story to do demonstrate the exploratory analysis you have done to support the explanatory analysis you are using in the meeting.
Narration
Perhaps your data doesn’t really require such an emotional tug to ensure action is taken. Perhaps all you are trying to do is provide some narration to help draw attention to help explain the data.
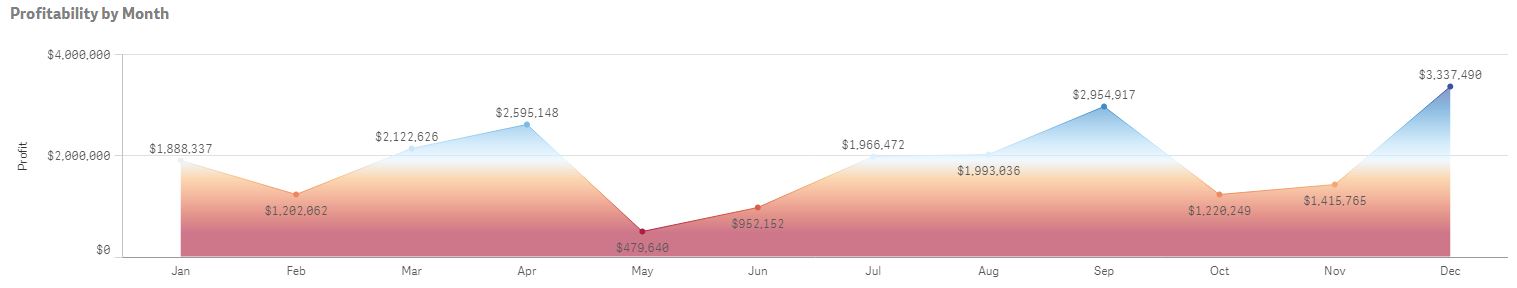
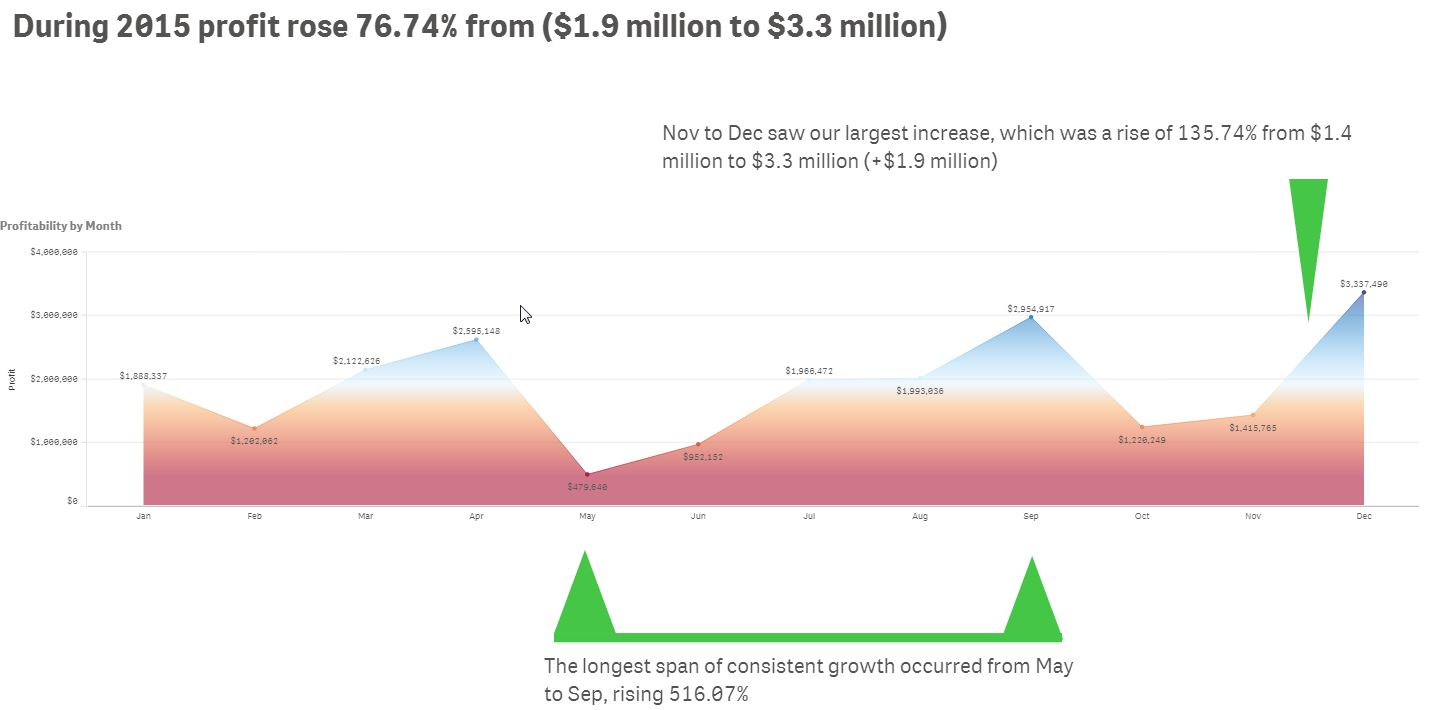
Consider the following chart before and after adding a few narrative elements are added to help the audience focus on the important things:
Openness
As I share on my About page I am far from an expert on any of the things I write about. I’m reading. Learning. Growing. Every single day just like you with the help of many others in the industry. Data is my thing and I own that. But I will be honest and tell you that providing narration for my stories is not something that comes naturally to me.
In fact the key points above … yeah I stole them. Well not actually stole them so much as I copied them to the clipboard and pasted them into my storyboard from what I think is one of the coolest new elements of technology that I’ve seen in a long time. It’s a narration extension for Qlik Sense that you simply tell which chart you want it to consider and it does the narration for you. That is a serious help to someone like me who is trying to learn how to help my audience understand the data that I’m presenting to them.
The fact that Qlik chose to construct it’s architecture using an Open API and the fact that anyone who can code can gain access to the patented Qlik technology while adding value through their secret sauce is what makes it possible for a group like Narrative Science who is blazing trails in the field of natural language to build such an awesome extension.
The following video will let you see the narrative science extension in action. If you are a Qlik customer you will get all of the instructions you need and can download this exciting new object from this download location that includes instructions on how to install and has it’s own video that demo....
To achieve, or not to achieve action
There was a day when all we had to do in our field was surface data. Yeah those days have long since passed. Our jobs now entail not only finding the needles in the data hay stacks but helping our leadership teams understand them so that they can take action. I challenge you today to grow not only in the field of Exploratory Analysis but also in the emerging field of Explanatory Analysis.
Become a storyteller.
Add narration to your charts rather than just pasting them into presentations because you think they look pretty.
Use your newly developed skills to “incite action” and effect real change in your organizations.
Finally quit being selfish and keeping my tips to yourselves. For crying out loud start sharing these pages with others and help them find my QlikDork.com blog page.