Unlock a world of possibilities! Login now and discover the exclusive benefits awaiting you.
- Qlik Community
- :
- Forums
- :
- Groups
- :
- Industry and Topics
- :
- Healthcare
- :
- Re: webinar: Readmission Dashboard
- Subscribe to RSS Feed
- Mark Topic as New
- Mark Topic as Read
- Float this Topic for Current User
- Bookmark
- Subscribe
- Mute
- Printer Friendly Page
- Feature this Topic
- Mark as New
- Bookmark
- Subscribe
- Mute
- Subscribe to RSS Feed
- Permalink
- Report Inappropriate Content
webinar: Readmission Dashboard
hi guys,
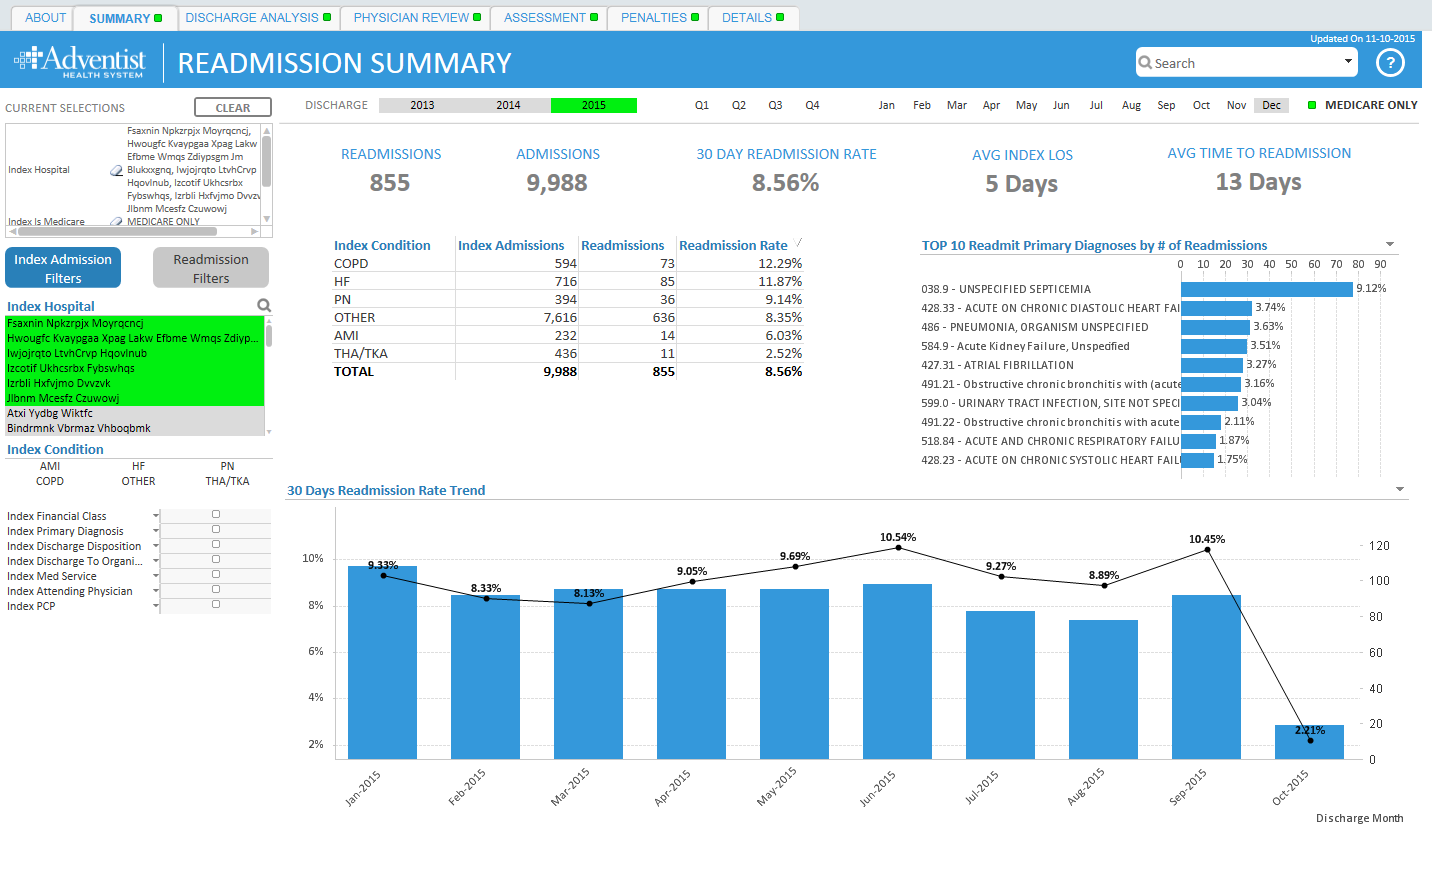
we will be doing a Qlik webinar today and showcase our Readmission Dashboard which was built in just 6 weeks. It is not too late to sign up or you can always watch the recording later
Recording is available here
Tracking and Trending Readmissions: A Data-Driven Approach
WEBINAR: Tracking and Trending Readmissions: A Data-Driven Approach
DATE: Wednesday, December 16
TIME: 2:00 p.m. ET
FEATURING: Kathy Butler, Sr. Manager of Clinical Data Governance and Analytics and Boris Tyukin, Business Intelligence Architect at Adventist Health System
Kathy and Boris will show you:
- How Adventist Health System provides clinicians, case managers, care coordinators and hospital leadership a new approach to tracking and trending readmissions
- How Analytics has informed partnerships with community services
- Technical deep-dive into the design of Adventist Health System solution along with a live demo
- Examples of how data has influenced decision making and process refinement.

- Mark as New
- Bookmark
- Subscribe
- Mute
- Subscribe to RSS Feed
- Permalink
- Report Inappropriate Content
I am in.
- Mark as New
- Bookmark
- Subscribe
- Mute
- Subscribe to RSS Feed
- Permalink
- Report Inappropriate Content
Let us know how the Webinar goes and hopefully you will upload the recording with a summary so that others can watch?
Thanks for your contributions to Qlik Community!
Sara
- Mark as New
- Bookmark
- Subscribe
- Mute
- Subscribe to RSS Feed
- Permalink
- Report Inappropriate Content
Looking forward to it, Boris and Kathy! That's a good looking app.
- Mark as New
- Bookmark
- Subscribe
- Mute
- Subscribe to RSS Feed
- Permalink
- Report Inappropriate Content
I would love to see the data model and load script that you built for this application. We were discussing the webinar in our office and wondering where the identification of readmissions is done -- in the database or in the load process?
- Mark as New
- Bookmark
- Subscribe
- Mute
- Subscribe to RSS Feed
- Permalink
- Report Inappropriate Content
thanks Peggy for attending!
Short answer is in the database. I would not mind to share the scripts but unfortunately it is a mix of PL/SQL packages and joins to some legacy tables built inhouse for many other purposes and it would not make a lot of sense to you. In a nutshell, we have some PL/SQL packages running on Cerner DB every night and these packages refresh two tables - one table with index encounters and another one with readmit encounters. These tables contain encounter IDs and conditions like COPD, AMI etc. There is also a a cross-ref table that maps ICD9s and ICD10s to those conditions (which also was a lot of work and this is where Kathy's knowledge was a big help). Then we use these two tables and pull a lot of additional data elements straight from Cerner such as discharge to location, patient info, PCPs etc. which was quite a challenge as well to find all these data elements. I think I used over 15 tables to get data we needed. ERD provided by Cerner you know is very far from being helpful but I was able to find most of the data by running various DA2 and PI reports and checking generated SQL.
Finally in QlikView, the model is very simple - main table with index encounter info, second table with readmit encounter info and lastly master calendar table connected by discharge date on index encounter.
Our DW team is working on a new version of our clinical DW and ultimately identification of readmissions will be done there.
If your organization is using Cerner's readmission module, you can explore readmission assessment tables and get encounter IDs from there. I think it is something that you can do very quickly as proof-of-concept without spending a lot of time on writing scripts for readmission identification. Of course in this case, you will be using readmission definition built by Cerner.
We will probably also add readmission risk score that Cerner recently integrated to Power Charts - it will be very cool to see how their predictive model actually works for our patients. Cerner claims they used over 700+ attributes to build this risk score and the best part it will be available for clinical staff to see right from Power Chart.
hope it helps!
- Mark as New
- Bookmark
- Subscribe
- Mute
- Subscribe to RSS Feed
- Permalink
- Report Inappropriate Content
Thank you for your detailed reply, Boris! We don't have Cerner and are dealing with pretty straightforward claims data in our EDW, which we join back to itself in order to identify the readmissions. We have started to talk about adding an indicator in the claims data, but I like your idea of an index admissions table and another readmissions table so we have all of the relevant information on both sides.
Perhaps one day we can present our readmissions dashboard!