Unlock a world of possibilities! Login now and discover the exclusive benefits awaiting you.
- Qlik Community
- :
- Forums
- :
- Groups
- :
- Industry and Topics
- :
- Scalability
- :
- Format Dimension axis labels
- Subscribe to RSS Feed
- Mark Topic as New
- Mark Topic as Read
- Float this Topic for Current User
- Bookmark
- Subscribe
- Mute
- Printer Friendly Page
- Feature this Topic
- Mark as New
- Bookmark
- Subscribe
- Mute
- Subscribe to RSS Feed
- Permalink
- Report Inappropriate Content
Format Dimension axis labels
Hi
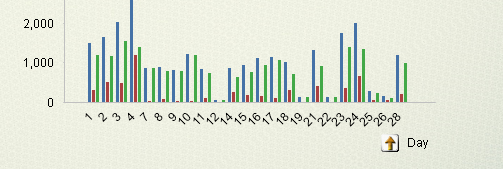
I have created a combo chart adding Day as Dimension. My requirement is to show WeekEnds by a different color
Appreciate any advice as to how to handle this. I need any solution in order to identify week ends.
Thanks
Senarath
- Tags:
- Group_Discussions
Accepted Solutions
- Mark as New
- Bookmark
- Subscribe
- Mute
- Subscribe to RSS Feed
- Permalink
- Report Inappropriate Content
Are you viewing this chart for one month at a time? Because 1 can be weekday for 1 month and weekend for another? If it is just 1 week at a time, then may be look at the attached
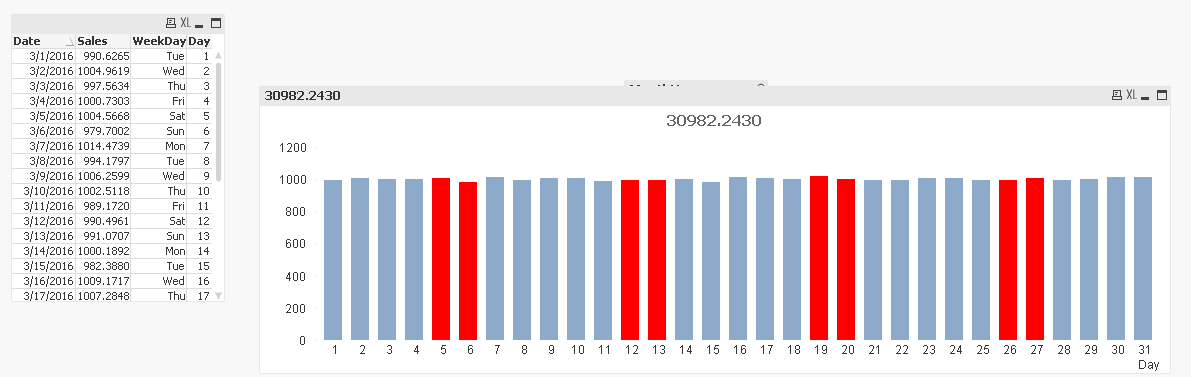
Script:
Table:
LOAD *,
WeekDay(Date) as WeekDay,
Day(Date) as Day,
Month(Date) as Month,
MonthName(Date) as MonthYear;
LOAD Date(MakeDate(2015, 12, 31) + RecNo()) as Date,
NORMINV(Rand(), 1000, 10) as Sales
AutoGenerate Today() - MakeDate(2015, 12, 31);
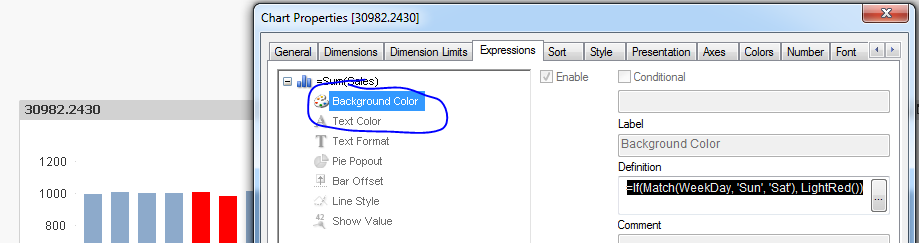
Expression used for color:
=If(Match(WeekDay, 'Sun', 'Sat'), LightRed())
- Mark as New
- Bookmark
- Subscribe
- Mute
- Subscribe to RSS Feed
- Permalink
- Report Inappropriate Content
Are you viewing this chart for one month at a time? Because 1 can be weekday for 1 month and weekend for another? If it is just 1 week at a time, then may be look at the attached
Script:
Table:
LOAD *,
WeekDay(Date) as WeekDay,
Day(Date) as Day,
Month(Date) as Month,
MonthName(Date) as MonthYear;
LOAD Date(MakeDate(2015, 12, 31) + RecNo()) as Date,
NORMINV(Rand(), 1000, 10) as Sales
AutoGenerate Today() - MakeDate(2015, 12, 31);
Expression used for color:
=If(Match(WeekDay, 'Sun', 'Sat'), LightRed())