- Mark as New
- Bookmark
- Subscribe
- Mute
- Subscribe to RSS Feed
- Permalink
- Report Inappropriate Content
Attachment has been updated.
- Mark as New
- Bookmark
- Subscribe
- Mute
- Subscribe to RSS Feed
- Permalink
- Report Inappropriate Content
Logically that seems like it should work; unfortunately, it gives a blank result.
- Mark as New
- Bookmark
- Subscribe
- Mute
- Subscribe to RSS Feed
- Permalink
- Report Inappropriate Content
Don't see the attachment 
- Mark as New
- Bookmark
- Subscribe
- Mute
- Subscribe to RSS Feed
- Permalink
- Report Inappropriate Content
I guess it's still loading? If it doesn't show up in a few minutes I'll upload again.
- Mark as New
- Bookmark
- Subscribe
- Mute
- Subscribe to RSS Feed
- Permalink
- Report Inappropriate Content
Updated attachment should be there now.
- Mark as New
- Bookmark
- Subscribe
- Mute
- Subscribe to RSS Feed
- Permalink
- Report Inappropriate Content
Hi,
Are you expecting following information?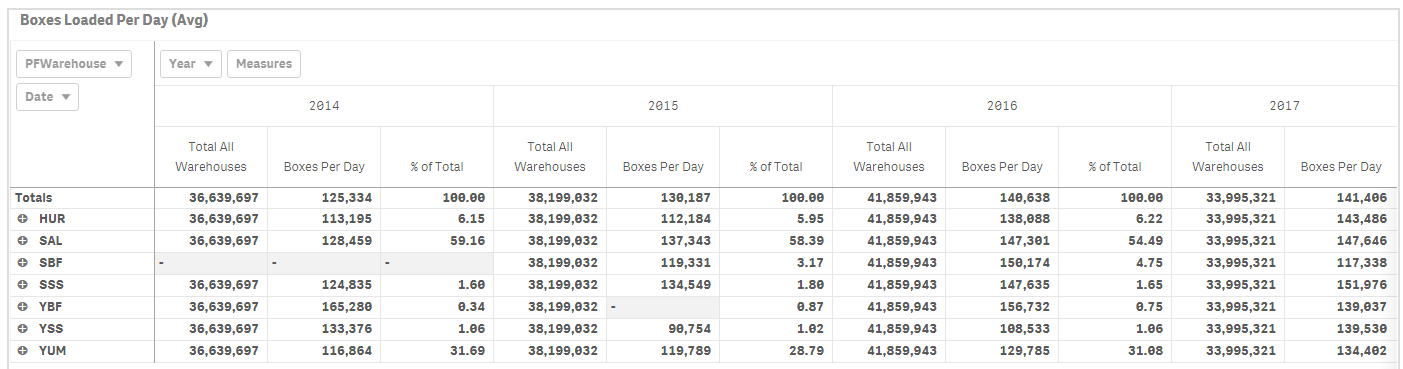
- Mark as New
- Bookmark
- Subscribe
- Mute
- Subscribe to RSS Feed
- Permalink
- Report Inappropriate Content
Hi Vijay,
No, the totals you have look like the totals for the whole year. I'm trying to get a total of all of the daily averages for each warehouse. Thanks.
- Mark as New
- Bookmark
- Subscribe
- Mute
- Subscribe to RSS Feed
- Permalink
- Report Inappropriate Content
Hi Sunny. Have you had a chance to look at the new attachment I loaded? Thank you.
.
- Mark as New
- Bookmark
- Subscribe
- Mute
- Subscribe to RSS Feed
- Permalink
- Report Inappropriate Content
Hi,
Is your requirement as follows
| PFWarehouse | Avg Boxes Loaded Per Day | Total | % |
| HUR | 125,098 | 928,151 | 13.48% |
| SAL | 139,650 | 928,151 | 15.05% |
| SBF | 131,870 | 928,151 | 14.21% |
| SSS | 134,232 | 928,151 | 14.46% |
| YBF | 148,953 | 928,151 | 16.05% |
| YSS | 123,223 | 928,151 | 13.28% |
| YUM | 125,125 | 928,151 | 13.48% |
Formula For Avg Boxes Loaded Per Day is Avg(Aggr(Sum({$<RecordType={"LOAD"}>} UnitsLoaded),Date))
Total is sum of each of those individual values for warehouse
- Mark as New
- Bookmark
- Subscribe
- Mute
- Subscribe to RSS Feed
- Permalink
- Report Inappropriate Content
That is the behavior I'm looking for. Are you able to replicate that behavior in a pivot table?
