Unlock a world of possibilities! Login now and discover the exclusive benefits awaiting you.
- Subscribe to RSS Feed
- Mark as New
- Mark as Read
- Bookmark
- Subscribe
- Printer Friendly Page
- Report Inappropriate Content
The table viewer is a gem.
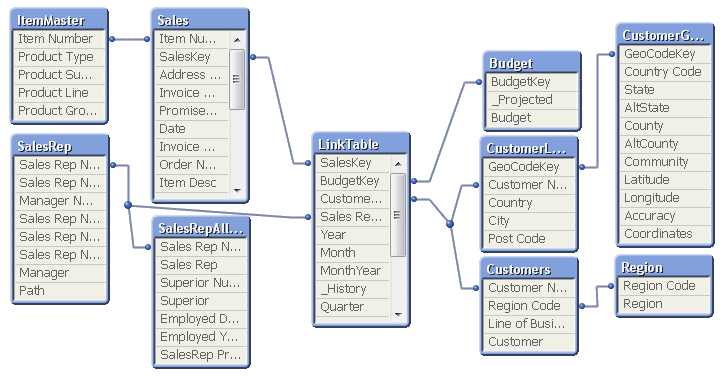
I use it for many things: to get an overview; to debug what I have done in the script; to check that all tables are linked; to check that I don’t have any unwanted synthetic keys; to preview data. I can hardly remember what I did before QlikView had it¹.

Just hit <ctrl>-T and you will see it.
I move around the tables until the structure corresponds to the picture I have in my head of the data. I tell new users developing applications to draw the wanted data model on a piece of paper so they know what the goal is. If they can't draw it on a piece of paper, they need to sit down and think. Or play around with data in QlikView until they can draw the data model. The structure seen in the table viewer then becomes an acknowledgement that the data model is correctly implemented. Or a warning that it isn't.
There are two modes of the table viewer: The Internal table view and the Source table view. The only difference is how the synthetic keys are displayed. During the script development, I always use the source table view, since it shows me exactly what I have done in the script.

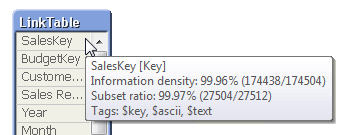
If you hover above the table headers, you can see the number of records and number of fields. If you hover above an individual field, you will get the data for this specific field: Whether it is a key, the information density, the subset ratio and – if applicable – the tags.
Many, when they see the table viewer, start thinking about a graphical tool to define which source data to load. But this is not what the table viewer is – it is a viewer only. Unfortunately or luckily, whichever way you look at it…
“Unfortunately” since a graphical tool no doubt would help many people, especially in the initial phase, when they want to load data quickly just to get a look at it. “Luckily”, since you never will get the same versatility using a graphical tool as you will with a script editor. For instance, almost all advanced data transformations I have shown in previous blog posts (e.g. How to populate a sparsely populated field) would be almost impossible to describe with a graphical tool. They would at least be very complex to depict, and most likely less user-friendly than having to write the actual code.
So, if we get a graphical script generator some day in the future, it should be some kind of hybrid where scripting still is allowed and we have the best of both worlds.
Until then, I will happily use the table viewer as it is: As the best available tool to get an overview of the data model. And as one of the best debugging tools in the application development process.
And that is not bad.
¹In fact, I do remember what we did before the table viewer existed: We used a cross table (a pivot table) with the system fields $Field and $Table as dimensions and Only([$Field]) as expression. It worked, but it did not give the same overview.
You must be a registered user to add a comment. If you've already registered, sign in. Otherwise, register and sign in.