Unlock a world of possibilities! Login now and discover the exclusive benefits awaiting you.
- Qlik Community
- :
- All Forums
- :
- QlikView App Dev
- :
- Re: How to split y axis?
- Subscribe to RSS Feed
- Mark Topic as New
- Mark Topic as Read
- Float this Topic for Current User
- Bookmark
- Subscribe
- Mute
- Printer Friendly Page
- Mark as New
- Bookmark
- Subscribe
- Mute
- Subscribe to RSS Feed
- Permalink
- Report Inappropriate Content
How to split y axis?
Hi there,
i found out, that there's a function called "Split Axis".
But it seemed it works only if you have 2 formulas and set the positions to left or right.
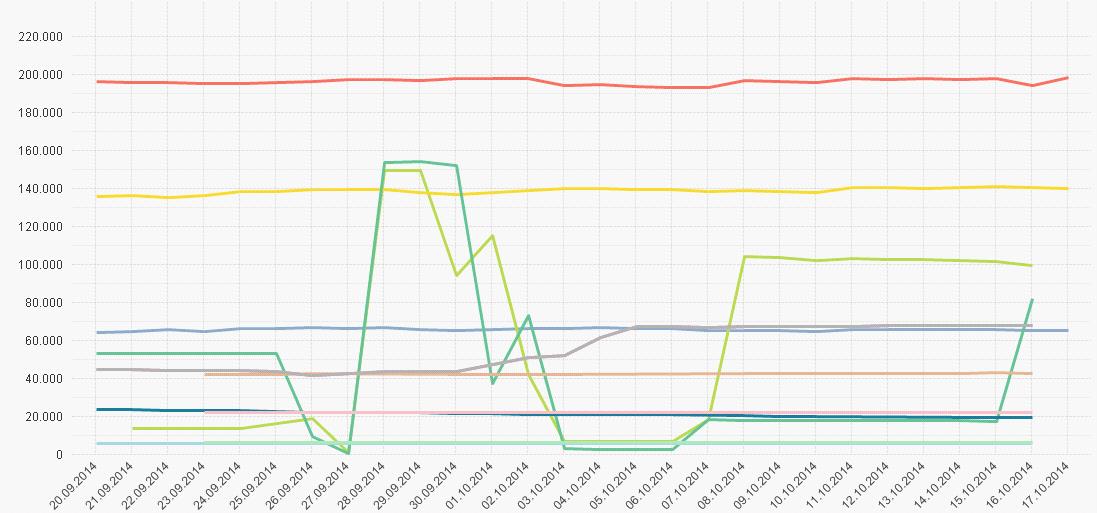
Now i have only one formula with values from 500 to 220.000 and i want to hide the area between 140.000 and 180.000 i.e.
Is there a possibility to solve this problem?
Thanks and regards from germany,
Sabrina
- Mark as New
- Bookmark
- Subscribe
- Mute
- Subscribe to RSS Feed
- Permalink
- Report Inappropriate Content
One way you can do this is by removing the data between 140.000 and 180.00 from your data set using set analysis.
Something like:
SUM({<Value={"<=180000 >=140000"}>} Value) to remove the data you don't want to see in your chart.
Hope this helps.
Regards
Andy
- Mark as New
- Bookmark
- Subscribe
- Mute
- Subscribe to RSS Feed
- Permalink
- Report Inappropriate Content
Thank you!
And what about, if i have more than one area to hide?
i.e. hide 20.000 to 40.000 and 80.000 to 100.000 and 160.000 to 200.000 ?
Thanks and best regards
Sabrina
- Mark as New
- Bookmark
- Subscribe
- Mute
- Subscribe to RSS Feed
- Permalink
- Report Inappropriate Content
Build your exclusions up something like
SUM({<Value={"<=20000 >=40000"}>},SUM({<Value={"<=18000 >=140000">} Value)) to build up your exclusions.
Another way to consider if you can is to add an exclusion flag to your data to remove the values from your dataset at or before load or using set analysis on the data once loaded.
SUM({<_ExclusionFlag={"=1"}>} Value)
Please mark replies as appropriate.
Regards
Andy
- Mark as New
- Bookmark
- Subscribe
- Mute
- Subscribe to RSS Feed
- Permalink
- Report Inappropriate Content
Hi Andy,
i don't have to build summarys because these are allready in the table and i have only reflect this in qlikview.
Thanks and regards,
Sabrina
- Mark as New
- Bookmark
- Subscribe
- Mute
- Subscribe to RSS Feed
- Permalink
- Report Inappropriate Content
Then building your exclusions of data using set analysis as you summarise the data is the way to go.
SUM(3rd Exclusion set, SUM(2nd Exclusion set, SUM(1st Exclusion set , Value)))