Unlock a world of possibilities! Login now and discover the exclusive benefits awaiting you.
- Qlik Community
- :
- All Forums
- :
- QlikView App Dev
- :
- Percentage Bar Chart
- Subscribe to RSS Feed
- Mark Topic as New
- Mark Topic as Read
- Float this Topic for Current User
- Bookmark
- Subscribe
- Mute
- Printer Friendly Page
- Mark as New
- Bookmark
- Subscribe
- Mute
- Subscribe to RSS Feed
- Permalink
- Report Inappropriate Content
Percentage Bar Chart
Can you do a percentage bar chart in qlikview? I have various numbers e.g the surgical times, the anaesthetic time, the turnaround time, total mins late start and total min early finish and I want to show them on a percentage chart, so 0 - 100% at the bottom and then show, for example, the total turnaround time was 8% of all of the times added together, the surgical time was 80% etc. Rather than what I have now which it is a stacked bar chart showing the actual numbers.
Hope this makes sense.
Thanks,
- Mark as New
- Bookmark
- Subscribe
- Mute
- Subscribe to RSS Feed
- Permalink
- Report Inappropriate Content
On the expression tab, try changing your expression to "Relative" which should be a check box in the middle of the tab towards the bottom.
- Mark as New
- Bookmark
- Subscribe
- Mute
- Subscribe to RSS Feed
- Permalink
- Report Inappropriate Content
This works and makes the different things percentages but it makes each one add up to 100% so on the bottom it goes up to 600%, I need all the fields to be taken into account to make 100%.
What do I need to do?
- Mark as New
- Bookmark
- Subscribe
- Mute
- Subscribe to RSS Feed
- Permalink
- Report Inappropriate Content
Hi Kate
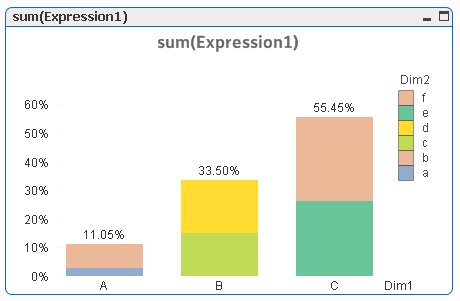
In that case you probably need to give me a bit more detail on you chart, expression, dimensions. I have just created a test application using the QlikView test script and created a bar chart using a simple Sum(Expression1) and switching it to relative, on a stacked chart it gives me exactly what you're looking for.
- Mark as New
- Bookmark
- Subscribe
- Mute
- Subscribe to RSS Feed
- Permalink
- Report Inappropriate Content
Ok, the chart is showing theatre utilisation in a hospital.
My expressions are:
Anaesthetic time - =sum(anaesthetic_time)
Surgical Time - = sum(surgical_time)
Turnaround time - =sum(turnaround_time)
late starts - =interval (sum(session_actual_start - scheduled_start), 'mm')
early finishes - =interval (sum(session_actual_finish - scheduled_finish), 'mm')
I have drill downs by specialty, consultant and theatre - I also have the operation dates to drill down by each day aswell.
I want the chart to show 100% and each one of the expressions a percentage in the chart. If i click on relative on all the expressions it works until i drill down, then it becomes 600% and then when i drill lower to each specific day they all just say 100% each.
Thanks for your help so far.
Kate Hunter
Information Analyst
Planned Care Team
Level 5
Derby Hospitals NHS Foundation Trust
Tel: 01332 788650
E-mail: Kate.Hunter3@nhs.net<mailto:Kate.Hunter3@nhs.net>
ext: 88650
- Mark as New
- Bookmark
- Subscribe
- Mute
- Subscribe to RSS Feed
- Permalink
- Report Inappropriate Content
Hi Kate
That's probably what your problem is then, QlikView will ensure that each expression adds to 100% whereas you want the sum of all to add to 100%.
Is there a way that you can see the total time?
What I mean is that each expression could be done like this:
Sum(Surgical_Time) / Sum(TOTAL total_time)
This assumes that total_time is a measure you have available, if this is not the case then you could probably do something like:
Sum(Surgical_time) / Sum(TOTAL Surgical_time + Anesthetic_time + + + )
- Mark as New
- Bookmark
- Subscribe
- Mute
- Subscribe to RSS Feed
- Permalink
- Report Inappropriate Content
Hi Kate
One approach would be to calculate each time as a percentage of the total time. So anaesthetic_time as a percentage of total would be:
anaesthetic_time / (anaesthetic_time+surgical_time+turnaround_time+interval (sum(session_actual_start - scheduled_start), 'mm')+interval (sum(session_actual_finish - scheduled_finish), 'mm'))
This makes for some pretty ugly expressions, that may slow things down. So I would move some of the logic into the data model itself if possible. Pre-calculating the late starts and early finishes would be a good place to start.
Note that there is a Surgical Dashboard app on demo.qlik.com that has a similar chart. But it shows the actual numbers like you said. It would be good to be able to toggle between numbers and the percentages when making comparisons, as both would provide interesting insights.
- Mark as New
- Bookmark
- Subscribe
- Mute
- Subscribe to RSS Feed
- Permalink
- Report Inappropriate Content
Hi,
I have added a total measure so I can divide by it to get a percentage. However when I don't drill on anything (so the hospital overall) it shows only up to 40% and then when i drill lower it does the same each section is 100%. I have attached some screen shots to show you what I mean.
Also, for early finishes measure there are some minus numbers. I don't want these to show. So if I type this:
=interval (sum(session_actual_finish - scheduled_finish), 'mm') / sum (total_scheduled_mins) (This is the formula to get the percentage for early finishes)
=if (interval (sum(session_actual_finish - scheduled_finish), 'mm') / sum (total_scheduled_mins) <0, 0) (This is to say if it is below zero show zero)
It isn't working, what am I typing wrong?
Thanks,
Kate Hunter
Information Analyst
Planned Care Team
Level 5
Derby Hospitals NHS Foundation Trust
Tel: 01332 788650
E-mail: Kate.Hunter3@nhs.net<mailto:Kate.Hunter3@nhs.net>
ext: 88650
- Mark as New
- Bookmark
- Subscribe
- Mute
- Subscribe to RSS Feed
- Permalink
- Report Inappropriate Content
Kate
I dont think you need to use the TOTAL keyword. This will cause it to sum a total across ALL members of the dimension. My understanding is you want 100% to be the total for each member of the dimension list (ie. a total for each hospital, not all hospitals).
In terms of dropping the negative values, are they included in the total measure? If so then dropping them from the detail will mean that they no longer sum up to the total measure, and you wont get 100%. If you want to ignore the negatives in each expression then you must ignore them in the total measure as well.
- Mark as New
- Bookmark
- Subscribe
- Mute
- Subscribe to RSS Feed
- Permalink
- Report Inappropriate Content
Hi Kate,
Please share if you were able to resolve this issue.