Unlock a world of possibilities! Login now and discover the exclusive benefits awaiting you.
- Qlik Community
- :
- All Forums
- :
- QlikView App Dev
- :
- Show total and 2 conditional values in chart
- Subscribe to RSS Feed
- Mark Topic as New
- Mark Topic as Read
- Float this Topic for Current User
- Bookmark
- Subscribe
- Mute
- Printer Friendly Page
- Mark as New
- Bookmark
- Subscribe
- Mute
- Subscribe to RSS Feed
- Permalink
- Report Inappropriate Content
Show total and 2 conditional values in chart
Hi i have a below mentioned data
| name | sales 2014 | sales 2015 | growth |
|---|---|---|---|
| A | 100 | 200 | 100 |
| B | 200 | 300 | 50 |
| C | 300 | 400 | 33 |
| D | 400 | 500 | 25 |
Now i want to show a chart
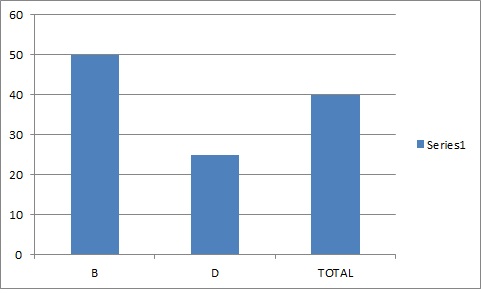
1) growth of company with name B
2) growth of company with highest sales in 2015 or rank one in sales 2015 i.e,D
3 total growth
thanks in advance
sanjay
- Tags:
- new_to_qlikview
- Mark as New
- Bookmark
- Subscribe
- Mute
- Subscribe to RSS Feed
- Permalink
- Report Inappropriate Content
Use three Expressions
1) SUM(if(NAME='B',Growth))
2)sum(if(aggr(rank(sum(Growth))=1,NAME),Growth))
3)Total Growth
- Mark as New
- Bookmark
- Subscribe
- Mute
- Subscribe to RSS Feed
- Permalink
- Report Inappropriate Content
pfa,
- Mark as New
- Bookmark
- Subscribe
- Mute
- Subscribe to RSS Feed
- Permalink
- Report Inappropriate Content
Hi Shiva,
The issue is I cannot see the names of companies.... since there is no dimension in it
I have achieved the same earlier...what you have done
however i want the names also ... so that i can show what the selected company's growth is and who is its best competitor(& its growth) and the market growth is.
- Mark as New
- Bookmark
- Subscribe
- Mute
- Subscribe to RSS Feed
- Permalink
- Report Inappropriate Content
u like tis?
- Mark as New
- Bookmark
- Subscribe
- Mute
- Subscribe to RSS Feed
- Permalink
- Report Inappropriate Content
Hi Shiva
For expression A, I dont want max of growth
I want the growth of company whose sales is max in 2015 ie, A
your expression is simply max(growth)
- Mark as New
- Bookmark
- Subscribe
- Mute
- Subscribe to RSS Feed
- Permalink
- Report Inappropriate Content
sorry i mentioned it as A earlier how ever its D