Unlock a world of possibilities! Login now and discover the exclusive benefits awaiting you.
- Qlik Community
- :
- All Forums
- :
- QlikView App Dev
- :
- flexible Date dimension according to location clos...
- Subscribe to RSS Feed
- Mark Topic as New
- Mark Topic as Read
- Float this Topic for Current User
- Bookmark
- Subscribe
- Mute
- Printer Friendly Page
- Mark as New
- Bookmark
- Subscribe
- Mute
- Subscribe to RSS Feed
- Permalink
- Report Inappropriate Content
flexible Date dimension according to location close date
Hi
I'm plotting counts of events happening over time, by month, using MonthYear as my chart dimension.
What I want is that the dimension is always populated, even during months where no events occur.
However, if the selected location has a close date, then the dimension should not display any points after that month.
To put it another way if there is no close date, display all points up to current month, with a zero displayed for any months were no events happened.
If there is a close date, display a zero for months where no events happened, but do not display any points after the month of the close date.
my main chart expression was originally
Sum ([Count]) + Sum({1} 0) to ensure in months where no event occurs, the chart displays a zero.
Some locations have closed, and there is a close date field.
I have wrapped that with the MonthName function, creating a PlotEndDate, which is either the Month Year of the close date, or the current maximum Month Year.
I tried using
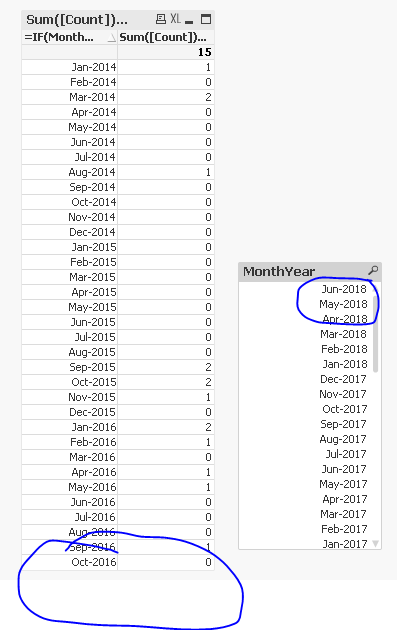
=IF(MonthYear<=[PlotEndDate],Sum ([Count]) + Sum({$} 0),Sum ([Count]) )as my main expression.
My calculate dimension is IF(MonthYear<=[PlotEndDate],MonthYear)
That works, in that if there is a closed date, I don't get any zero values plotted for months beyond that.
However, it doesn't satisfy the need to plot a zero for any months prior to the close date, where no event occurred.
If I change the chart expression
=IF(MonthYear<=[PlotEndDate],Sum ([Count]) + Sum({1} 0),Sum ([Count]) ), then I'm back to have all months plotted, even past the close date.
Any thoughts or pointers on the best way to achieve this? Or is it not possible because its almost looking for conditional nulls?
EDIT - with regards to the dimension, I have experimented with suppress when value is null, and generally I get the best results with this selected
Message was edited by: John MacKintosh Added extra info about suppress when value is null
- « Previous Replies
-
- 1
- 2
- Next Replies »
Accepted Solutions
- Mark as New
- Bookmark
- Subscribe
- Mute
- Subscribe to RSS Feed
- Permalink
- Report Inappropriate Content
How about this
=Aggr(If(MonthYear < Only(TOTAL <Location> [PlotEndDate]), MonthYear), Location, MonthYear)
- Mark as New
- Bookmark
- Subscribe
- Mute
- Subscribe to RSS Feed
- Permalink
- Report Inappropriate Content
Did you try this
Dimension
IF(MonthYear<=[PlotEndDate],MonthYear)
Expression
Sum ([Count]) + Sum({$} 0)
and then 'Suppress When Value is Null' on the dimensions tab
- Mark as New
- Bookmark
- Subscribe
- Mute
- Subscribe to RSS Feed
- Permalink
- Report Inappropriate Content
Hi Sunny,
Thanks
I've just tried this.
It correctly stops points plotting after the close date, but doesn't plot zeros for months in between start date and close date where no event occurs.
I have 'Suppress When Value is Null' on the dimensions tab checked.
- Mark as New
- Bookmark
- Subscribe
- Mute
- Subscribe to RSS Feed
- Permalink
- Report Inappropriate Content
Would you be able to share a sample to test and play around with?
- Mark as New
- Bookmark
- Subscribe
- Mute
- Subscribe to RSS Feed
- Permalink
- Report Inappropriate Content
What is Sum(Count) here?
- Mark as New
- Bookmark
- Subscribe
- Mute
- Subscribe to RSS Feed
- Permalink
- Report Inappropriate Content
Sorry Sunny - not thinking, its already summarised - Events is the Sum(Count)
Ignore that, and I'll get some raw non/summarised data together
I'm going to delete that spreadsheet now
- Mark as New
- Bookmark
- Subscribe
- Mute
- Subscribe to RSS Feed
- Permalink
- Report Inappropriate Content
Sounds good 
- Mark as New
- Bookmark
- Subscribe
- Mute
- Subscribe to RSS Feed
- Permalink
- Report Inappropriate Content
It's very hot in Scotland today.
We're not used to it.. brains don't work
- Mark as New
- Bookmark
- Subscribe
- Mute
- Subscribe to RSS Feed
- Permalink
- Report Inappropriate Content
Here is a minimal example.
There should Counts of 1 or 2 per month when summarised by month
Ideally I'd like zero's plotted in between times.
And nothing past the plot end date.
- Mark as New
- Bookmark
- Subscribe
- Mute
- Subscribe to RSS Feed
- Permalink
- Report Inappropriate Content
Try this as a calculated dimension
=IF(MonthYear <= Only(TOTAL [PlotEndDate]), MonthYear)
- « Previous Replies
-
- 1
- 2
- Next Replies »