Unlock a world of possibilities! Login now and discover the exclusive benefits awaiting you.
- Qlik Community
- :
- Support
- :
- Support
- :
- Knowledge
- :
- Member Articles
- :
- Image Resolution Management for PDF Output
- Move Document
- Delete Document
- Subscribe to RSS Feed
- Mark as New
- Mark as Read
- Bookmark
- Subscribe
- Printer Friendly Page
- Report Inappropriate Content
Image Resolution Management for PDF Output
- Move Document
- Delete Document
- Mark as New
- Bookmark
- Subscribe
- Mute
- Subscribe to RSS Feed
- Permalink
- Report Inappropriate Content
Image Resolution Management for PDF Output
Nov 10, 2015 6:24:58 AM
Nov 10, 2015 6:24:58 AM
The quality of images in PDF output generated from Word, PowerPoint, and PixelPerfect reports can be regulated according with the JPEG compression parameter (refer to http://en.wikipedia.org/wiki/JPEG#Effects_of_JPEG_compression😞
- PowerPoint: High = 100, Medium = 60, Low = 20
- Word: High = 100, Medium = 66, Low = 33
- Excel: option not available
- PixelPerfect: High, Medium, Low
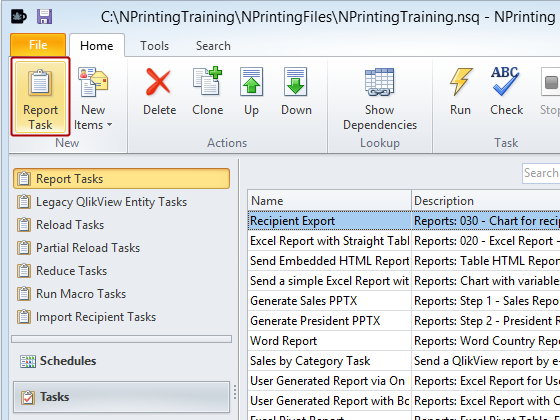
Create New PowerPoint Report and Open Template Editor
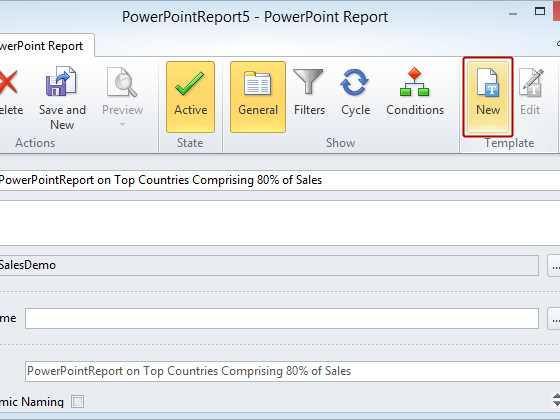
Create PowerPointReport on Top Countries Comprising 80% of Sales. See: How to Create PowerPoint Reports
Open "Save template as..." Dialog
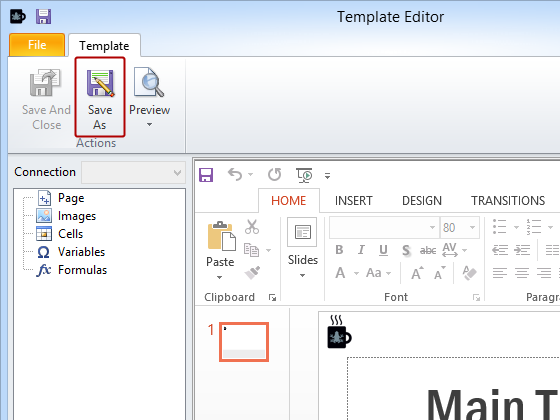
Click on the Save As icon in the Actions group
Save Template
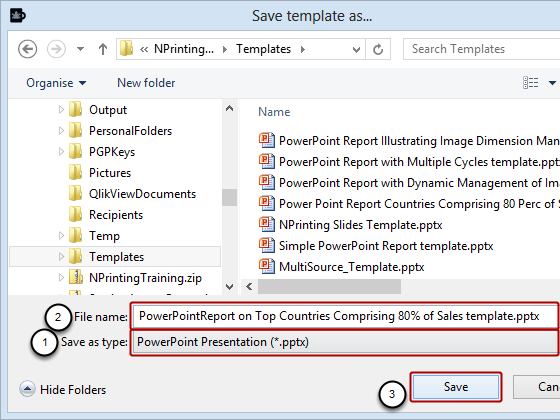
- Make sure that PowerPoint Presentation (*.pptx) is selected in the Save as type: field
- Enter a File name or accept the suggested one
- Click on the Save button
Create Title Slide
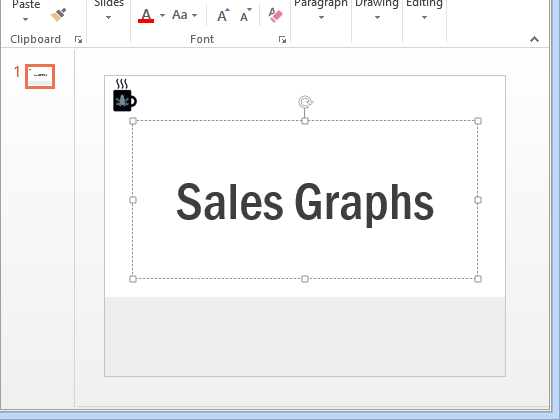
Enter, position and format the presentation title.
Add QlikView Objects to Template as Images and Create Content Slide
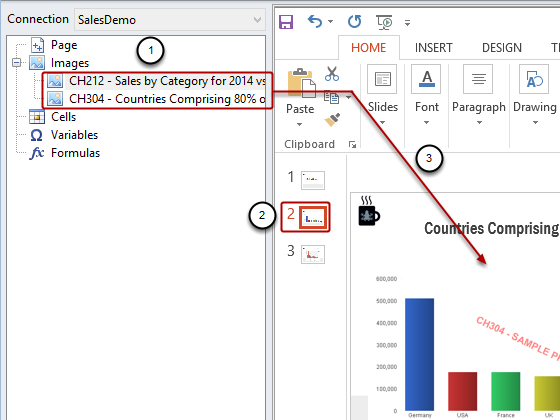
- Add CH304 and CH212 to the template as Images
- Add a slide to the template
- Drag and drop the CH304 - Countries Comprising 80% of Sales node token onto the slide and add a slide heading
Add Second Content Slide
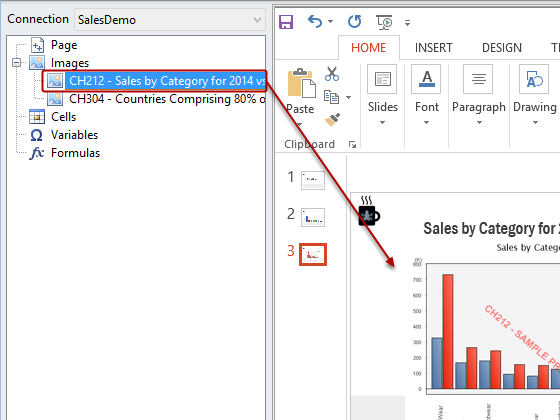
Add content to the third slide
Save Template
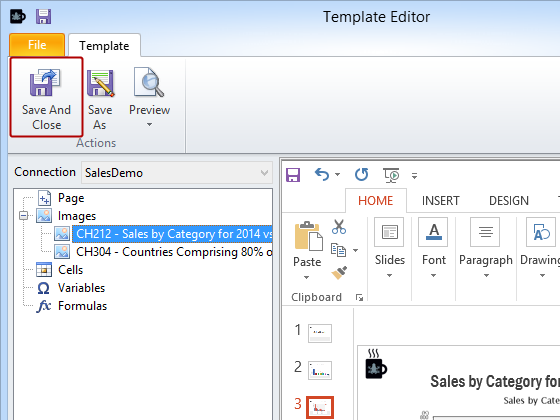
Click on the Save and Close icon.
Enable Dynamic Naming and Add Time Element
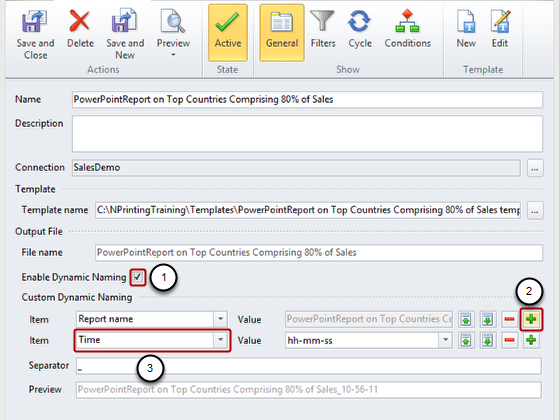
- Put a check mark in the Enable Dynamic Naming box by clicking on it
- Add another Item to the file name by clicking on the green plus at the extreme right of the Item row
- Select Time in the Item drop down list
Save Report Template
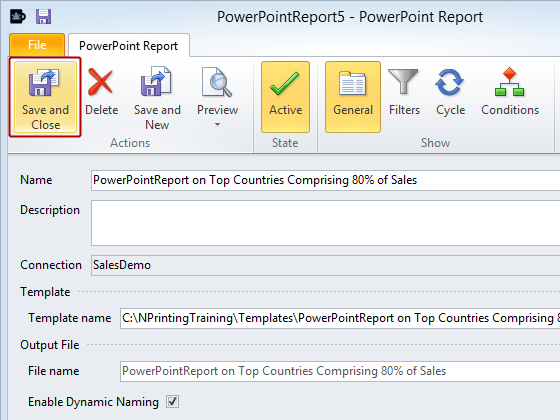
Click on the Save and Close icon
Add Report to Task
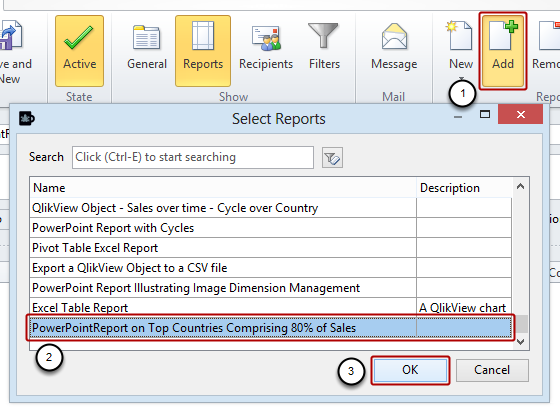
- Click on the Add icon in the Reports group
- Select the PowerPoint Report on Top Countries Comprising 80% of Sales report
- Click on the OK button to add it to the Task
Change Output Format
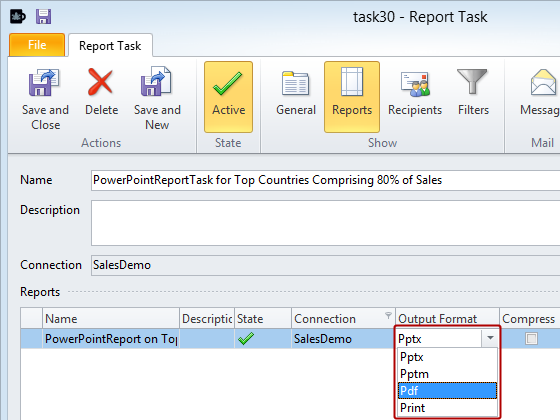
Click on the Output Format cell for the report and select Pdf in the drop-down menu
Add Same Report to Task a Second Time
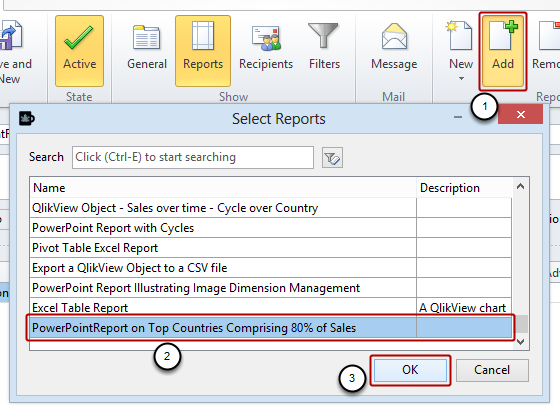
See sequence above.
Adjust Output Format Properties
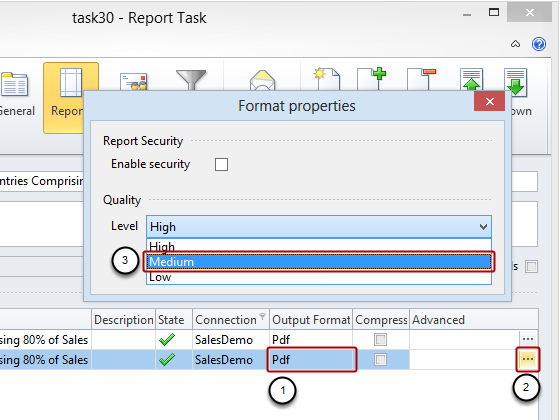
- Change the report Output Format to Pdf
- Click on the additional options button at the extreme right of the row under Advanced to open the Format properties dialog
- Set Quality Level to Medium
Add Same Report to Task One Last Time and Adjust Output Format Properties
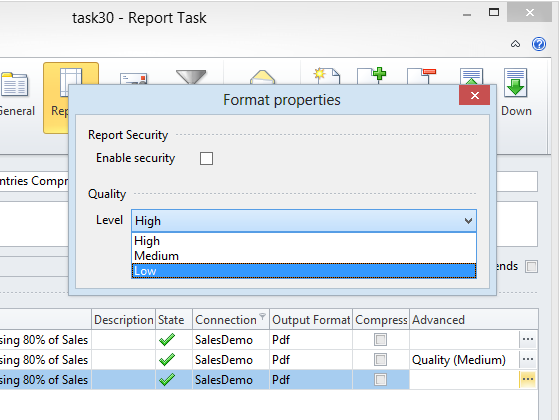
- Change the report Output Format to Pdf
- Click on the additional options button at the extreme right of the row under Advanced to open the Format properties dialog
- Set Quality Level to Low
Save Report Task
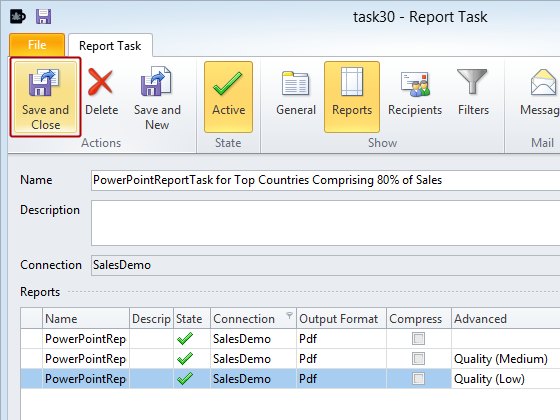
Click on the Save and Close icon
Run Task and Check Output
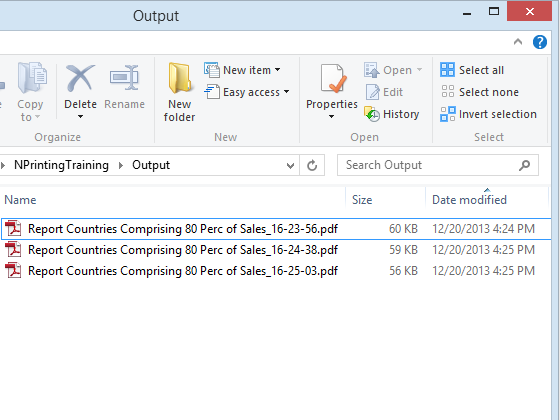
See the three separate PDF output files created due to the Time element in the output file name. The default high resolution one created at 16:23:56, the medium resolution one created at 16:24:38, and the low resolution one created at 16:25:03.
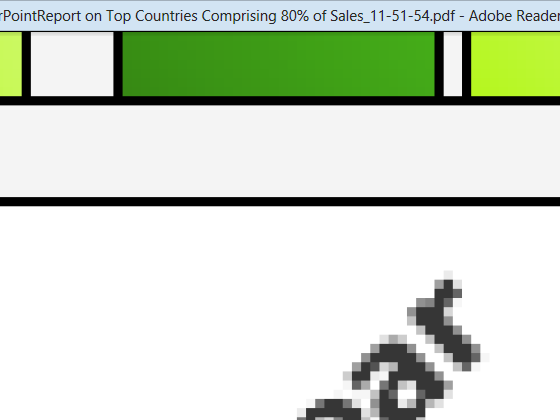
Zoom in a High Resolution Output
Zoom in a Low Resolution Output
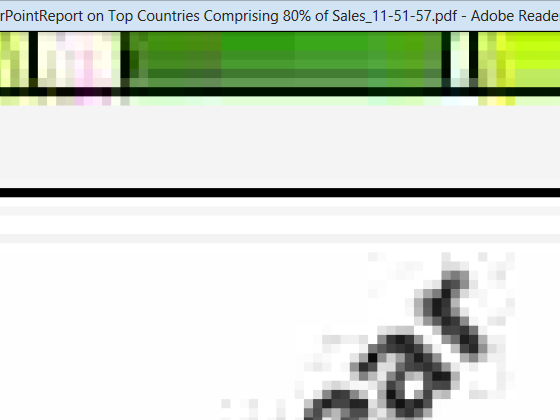
A report with low resolution images saves disk space but the quality of the final result can be compromised.
