Description: Learn how to create PixelPerfect Charts filled with QlikView data.
Create New Template
Launch NPrinting and open the C:\NPrintingTraining\NPrintingFiles\NPrintingTraining.nsq file
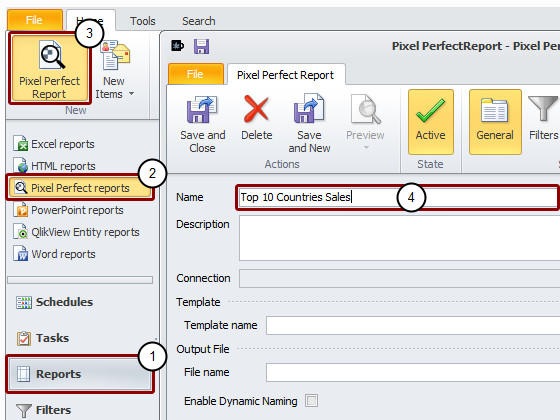
Go to Reports
Select PixelPerfect reports
Click on the PixelPerfect Report button to create a new one
Change the name to Top 10 Countries Sales
Click on New to create a new template. The template editor will open.
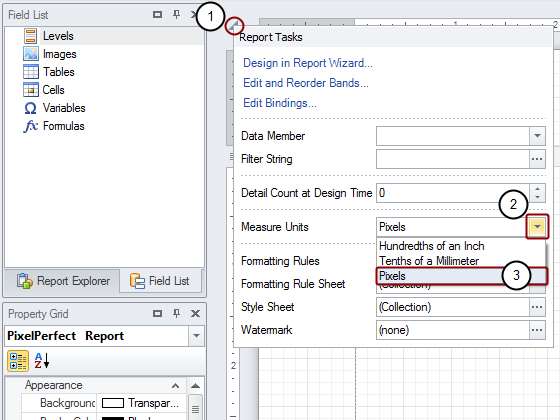
Set Grid Scale Units
Click on the triangle in the corner between the two rulers
Open the drop-down menu of the Measure Units field
Select Pixels from the menu
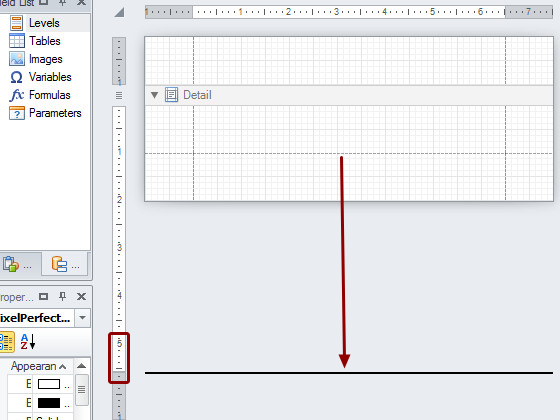
Increase Chart Area
Click on the bottom margin dotted line and drag it to the 550 pixel mark to increase the area of the report reserved for the chart. Read the height on the vertical ruler.
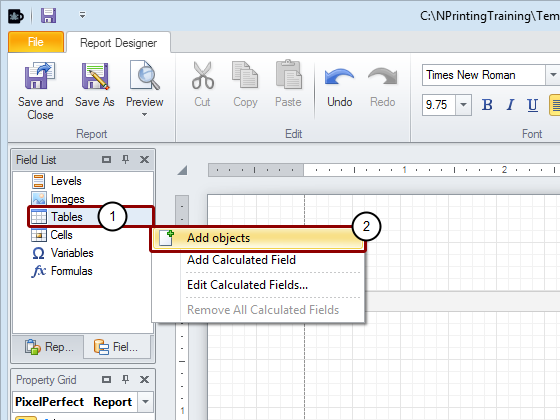
Add QlikView Object
Right click on the Tables node
Select Add objects
Select Table Object
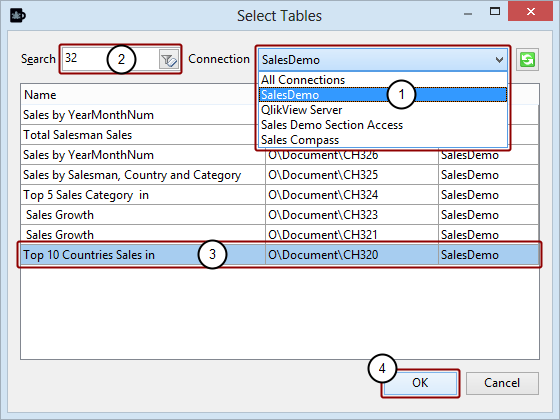
Select the Connection to the QlikView document that contains the table you want
Enter '3' and '2' in the Select TablesSearch field
Select the Top 10 Countries Sales in chart from the SalesDemo connection
Click on the OK button
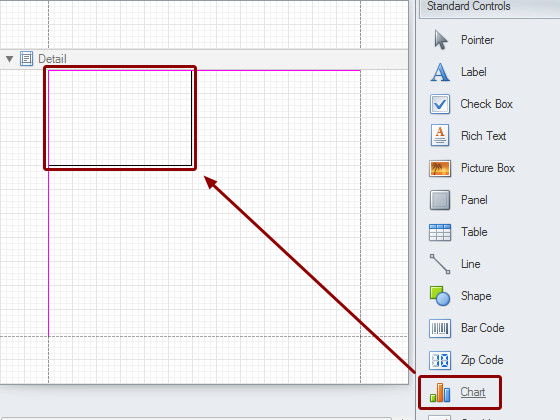
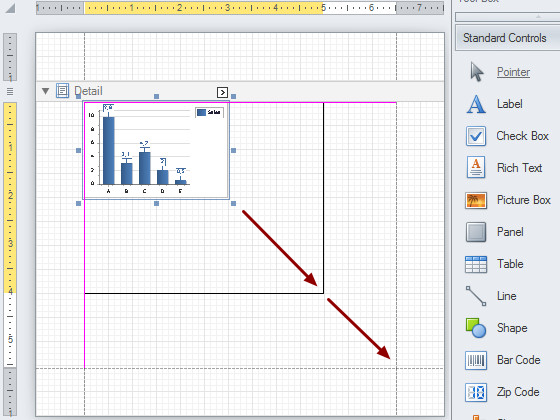
Embed New Chart
From the Toolbox on the right side select the Chart object then drag and drop it into the Detail area. The Chart wizard will open.
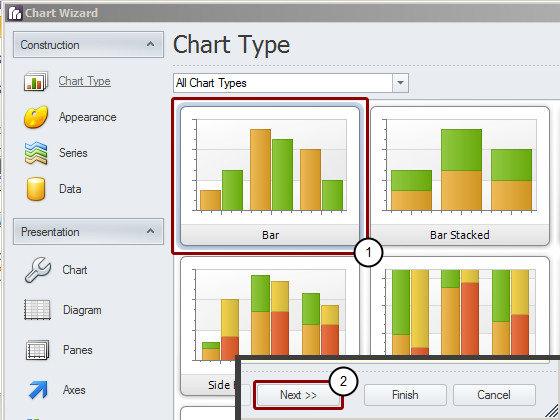
Select the Chart Type
Leave the Bar type chart selected
Click on Next button at the bottom of the wizard
Click on Next again to reach the Series window
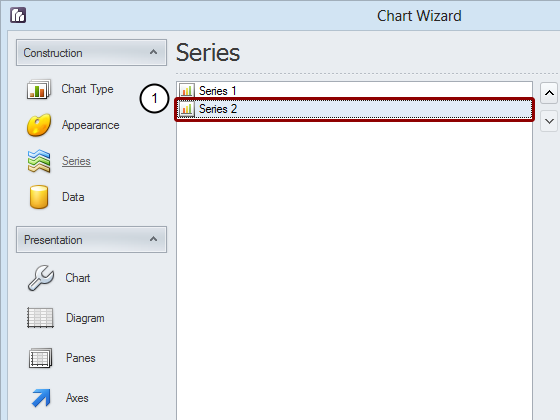
Delete Useless Data Sources
Select Series 2
Click on the Remove button at the bottom of the Series pane
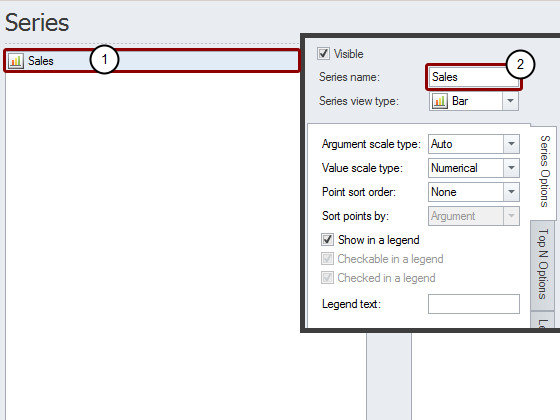
Rename Series 1
Series 1 will be selected automatically
Enter Sales as the new Name for Series 1
Click on Next at the bottom of the wizard
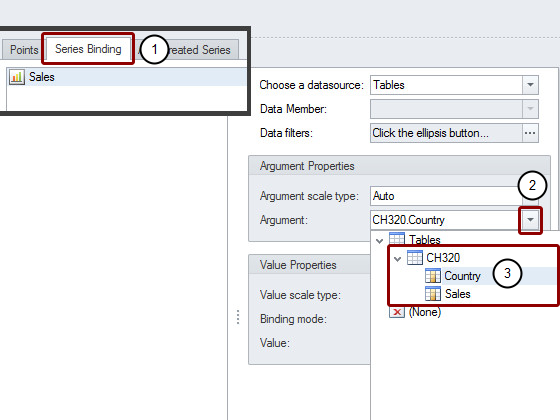
Configure Argument
Select the Series Binding tab
Open the Argument drop-down menu in the Argument Properties area
Expand the node CH320 and double click on the Country field to select it
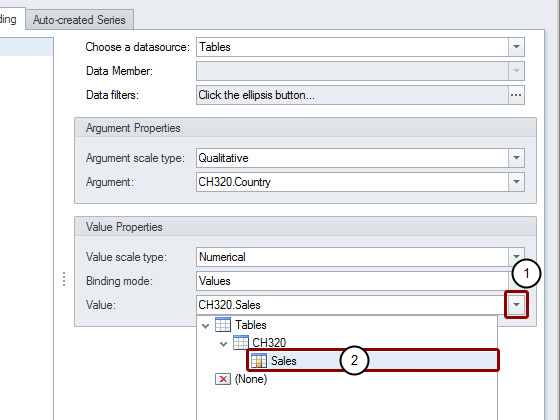
Configure Values
Open the Value drop-down menu in the Value Properties area
Double click on the Sales field
Click on Next
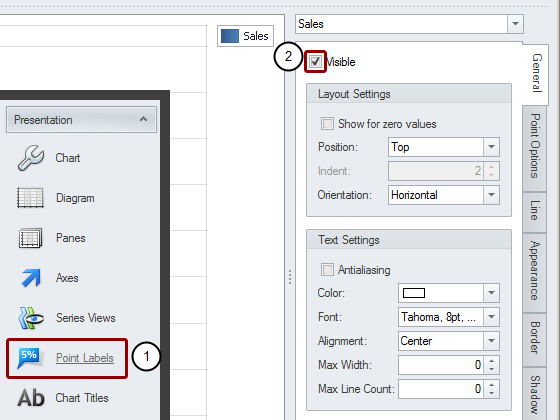
Hide Point Labels
Click on Point Labels in the Presentation area at the left
Remove the Visible flag
Click on Finish in the bottom right corner
Set Chart Dimensions
Drag the bottom right corner of the chart to fill all the available space.
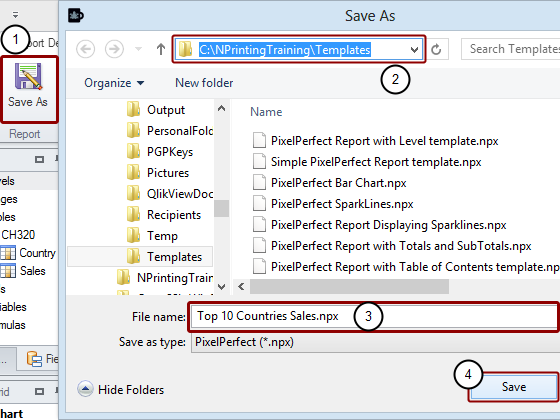
Save the Template
Click on the Save As icon in the Report group of the tool bar
Make sure that the Save As window is set to save in the C:\NPrintingTraining\Templates\ folder
Confirm the File Uame, Top 10 Countries Sales.npx
Click on the Save button
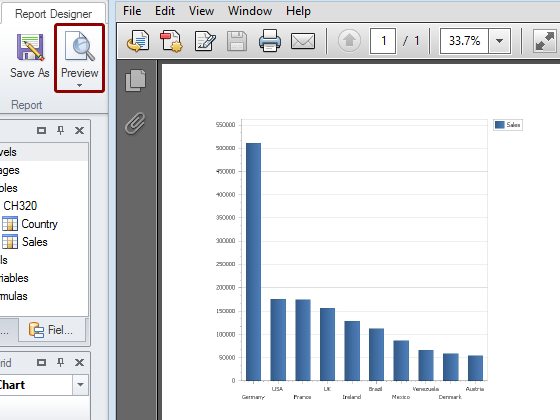
Preview Report
Click on the Preview icon in the Report group to check the final result.