Unlock a world of possibilities! Login now and discover the exclusive benefits awaiting you.
- Qlik Community
- :
- Support
- :
- Support
- :
- Knowledge
- :
- Member Articles
- :
- Set a QlikView Variable to a Specific Value Using ...
- Move Document
- Delete Document
- Subscribe to RSS Feed
- Mark as New
- Mark as Read
- Bookmark
- Subscribe
- Printer Friendly Page
- Report Inappropriate Content
Set a QlikView Variable to a Specific Value Using Filters
- Move Document
- Delete Document
- Mark as New
- Bookmark
- Subscribe
- Mute
- Subscribe to RSS Feed
- Permalink
- Report Inappropriate Content
Set a QlikView Variable to a Specific Value Using Filters
Description: Use NPrinting filters to set the value of a variable in a QlikView document. This tutorial uses SalesDemo.qvw
You have to create the needed variables in your QlikView application and refresh the objects list before to start this tutorial.
Begin Creating New Excel Report
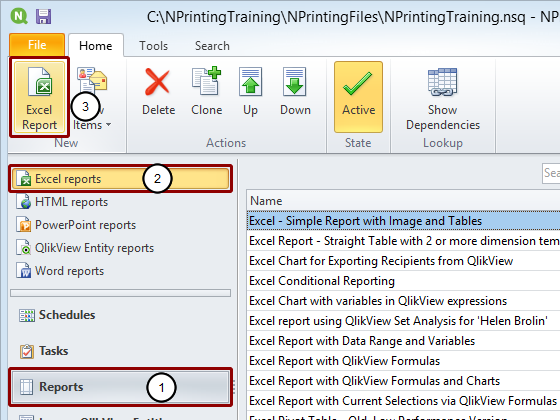
- Select Reports in the lower left pane
- Select Excel reports in the upper left pane
- Click on Excel Report in the New group of the tool bar
Identify New Report
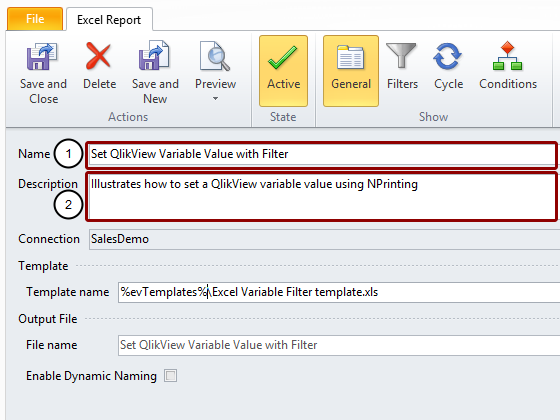
- Enter Set QlikView Variable Value with Filters as report Name
- Enter a clarifying Description if need be (optional)
Begin Creating New Filter
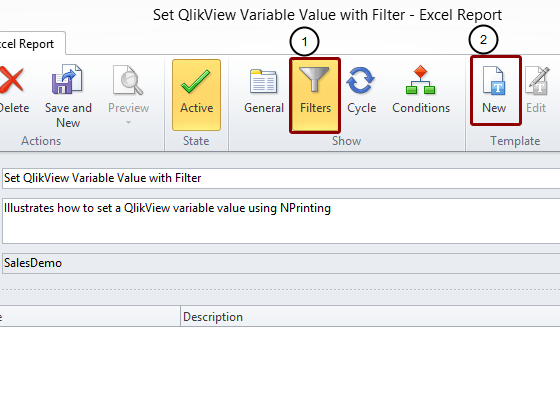
- Click on the Filters icon in the Show group of the tool bar
- Click on the New icon in the Filters group of the tool bar
Identify Filter
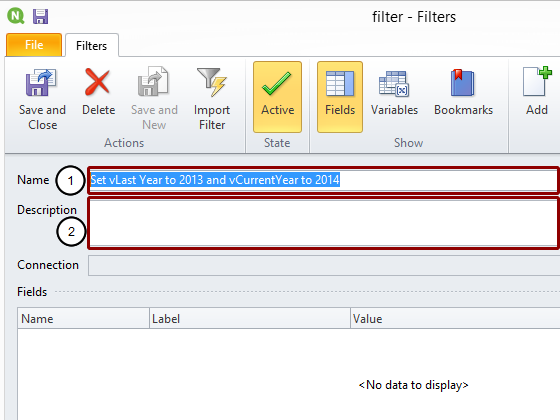
- Enter Set vLast Year to 2013 and vCurrentYear to 2014 as filter Name
- Enter a clarifying Description if need be (optional)
Open Variable Configuration Window
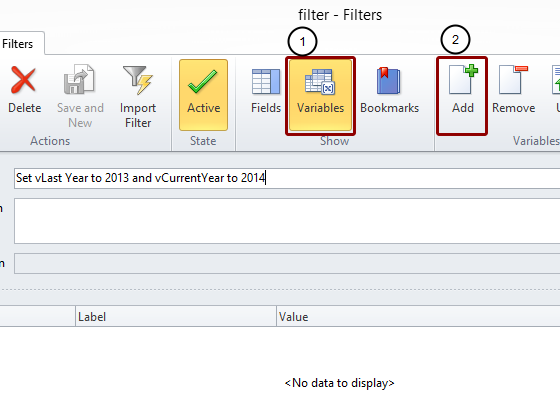
- Select the Variables icon in the Show group of the tool bar
- Click on the Add icon in the Variables group of the tool bar
Open Select Variable Window
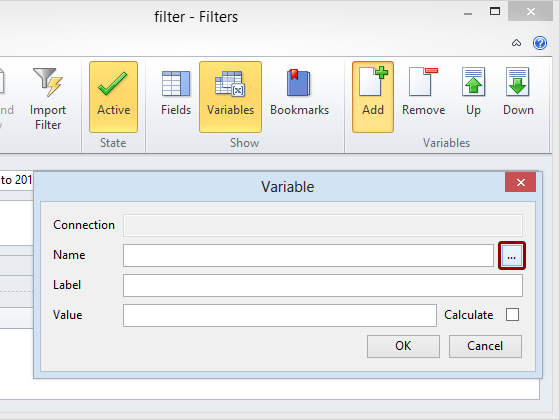
Click on the browse button at the extreme right of the Name field in the Variable window
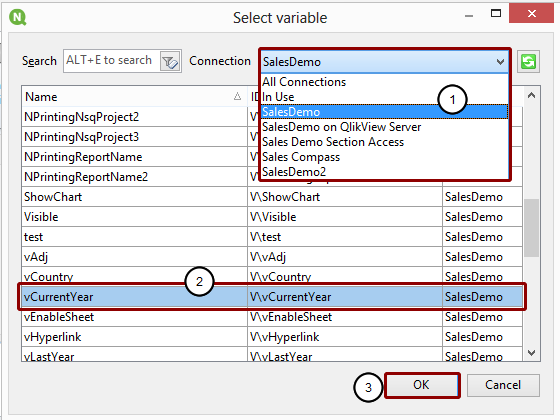
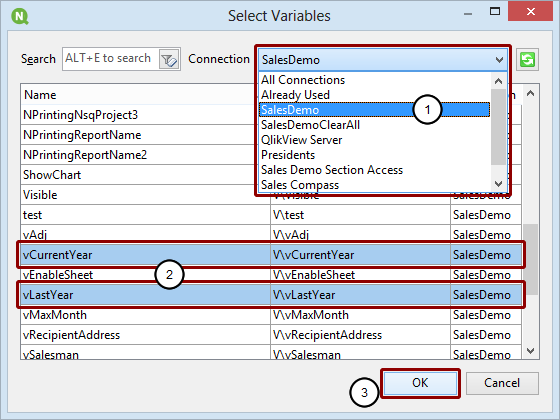
Select Variable
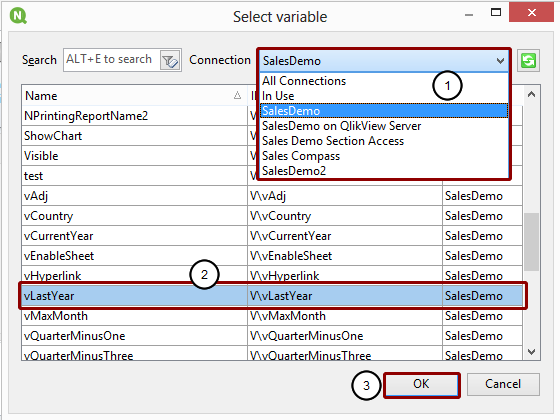
- Select the Connection to the QlikView document that contains the Variable you want
- Select the vLastYear variable
- Click on the OK button
Set Variable Value
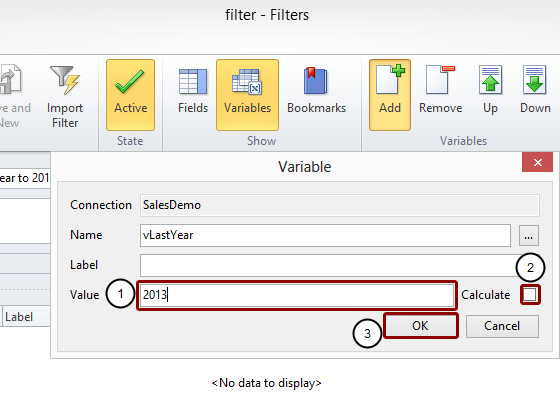
- Enter 2013 in the Value field
- Put a check mark in the Calculate box only if you enter a formula in the Value field, as it will need to be evaluated by QlikView. A constant has been entered here, so leave the Calculate box unchecked
- Click on the OK button
Add Another Variable

- Click on the Add icon again
- Click on the browse button again
Set Another Variable Value
- Select the Connection to the QlikView document that contains the Variable you want
- Select the vCurrentYear variable
- Click on the OK button
Set vCurrentYear to 2014
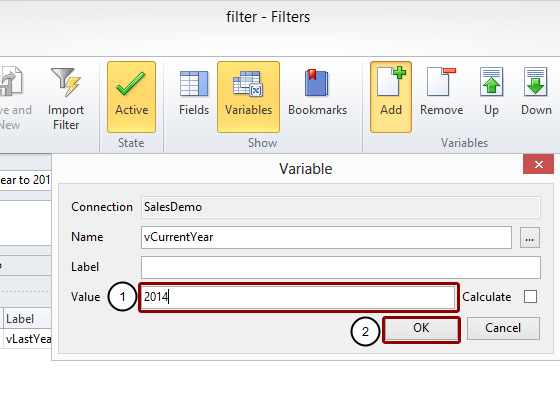
- Enter 2014 in the Value field
- Click on the OK button
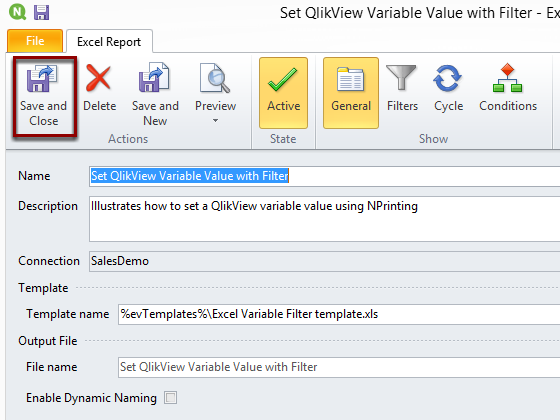
Save Filters
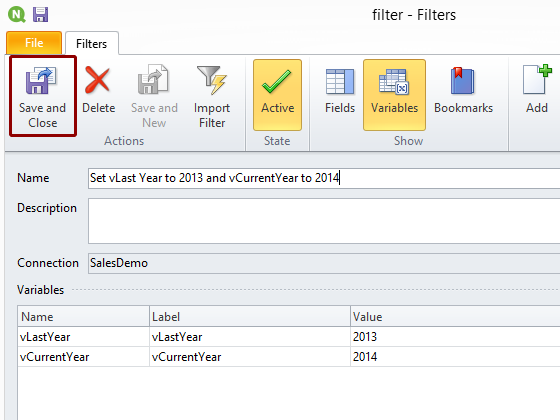
Click on the Save and Close icon in the Actions group.
Open New Template in Template Editor

Click on New in the Template group of the tool bar.
Open "Save template as..." Window
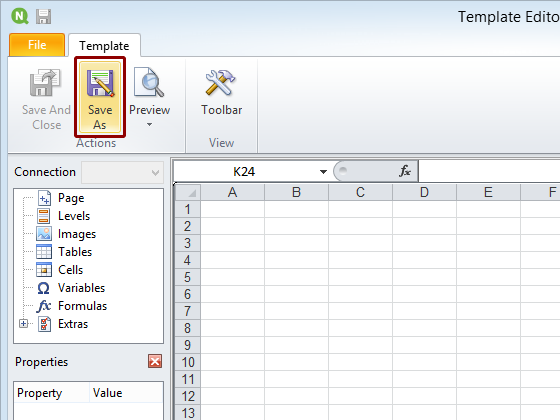
Click on the Save As icon in the Actions group.
Save Template
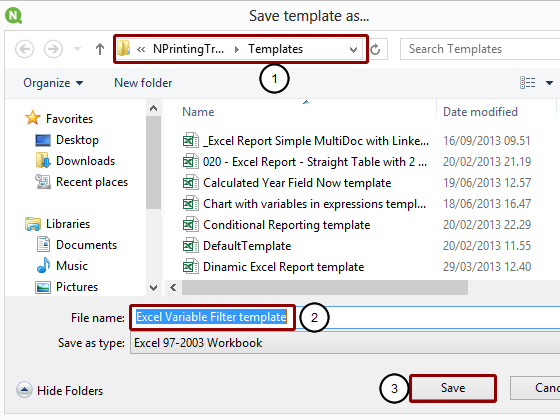
- Make sure the Save template as... window has opened in the C:\NPrintingTraining\Templates\ folder. If not, browse to it.
- Enter a File name or accept the suggested one
- Click on the Save button
Open Select Objects Window

- Right click on the Tables node
- Click on the Add objects button
Select Object to Embed as Table
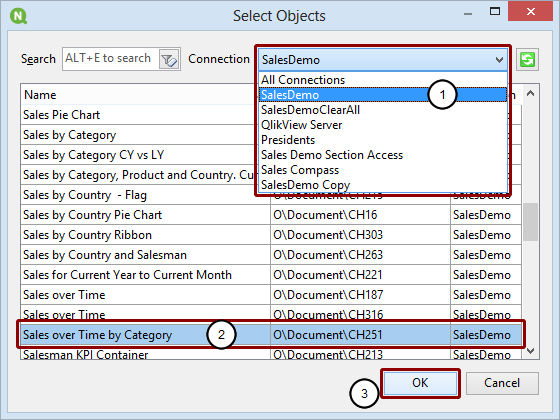
- Select the Connection to the QlikView document that contains the object to be added as a table
- Select the Sales over Time by Category - CH251 object
- Click on the OK button
Open Select Variables Window
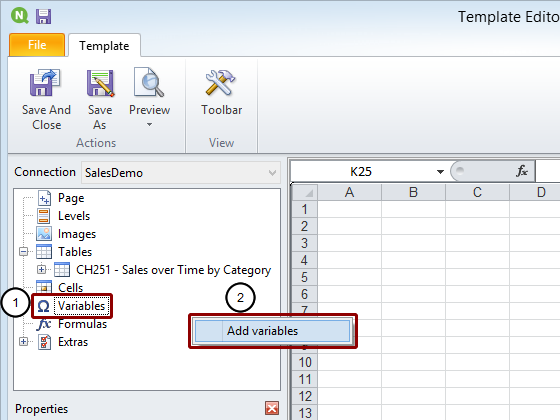
- Right click on the Variables node
- Click on the Add variables button
Select Variables to Be Added
- Select the Connection to the QlikView document that contains the object(s) to be added as a table
- Select the vCurrentYear and vLastYear objects from the SalesDemo connection.
- Click on the OK button
Add Headings to and Embed Variables in Template
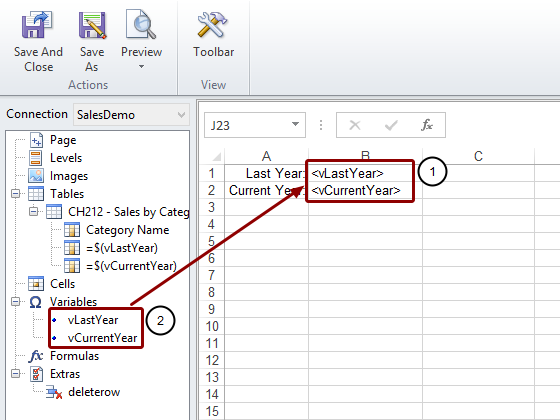
- Enter the headings Last Year and Current Year into cells A1 and B1 respectively
- Drag the variables vLastYear and vCurrentYear and drop them onto cells A2 and B2 respectively
Embed Table Columns in Template

- Expand the CH251 - Sales over Time by Category node by clicking on the '+' to its left
- Drag the Category Name, =$(vLastYear), and =$(vCurrentYear) node tokens into the template and drop them onto cells B4, C4, and D4 respectively
Change Headings
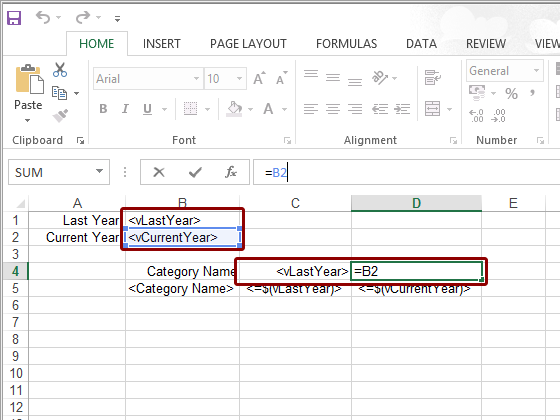
Substitute the =$(vLastYear), and =$(vCurrentYear) headings with =B1 and =B2 respectively.
Apply Formatting
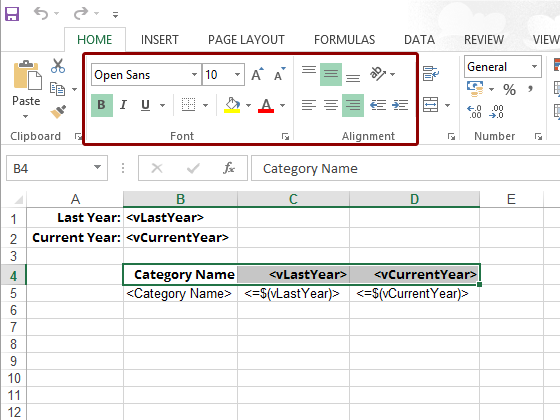
Use Excel formatting tools to format headings and data.
Run Preview
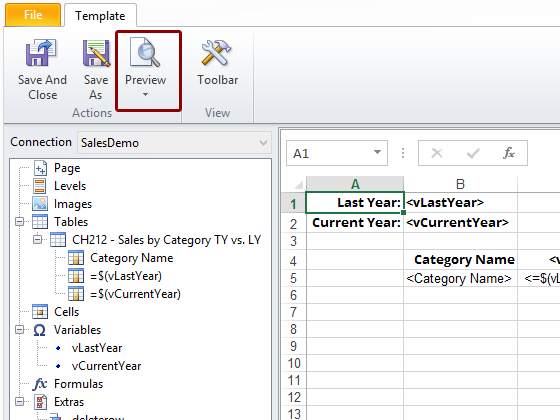
Click on the upper part of the Preview icon in the Actions group of the tool bar.
Inspect Results
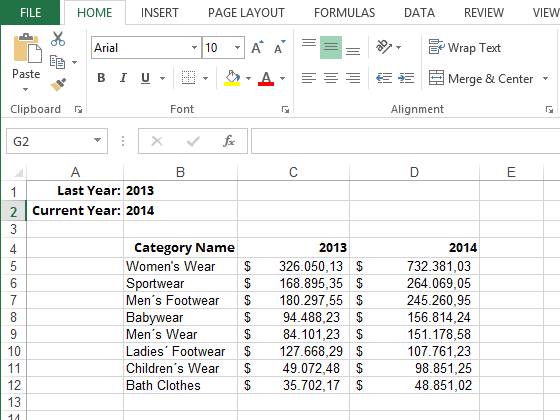
You will see the data for 2013 and 2014 regardless of the year in which you launch the preview.
Save Your Work in Template and Close Template Editor
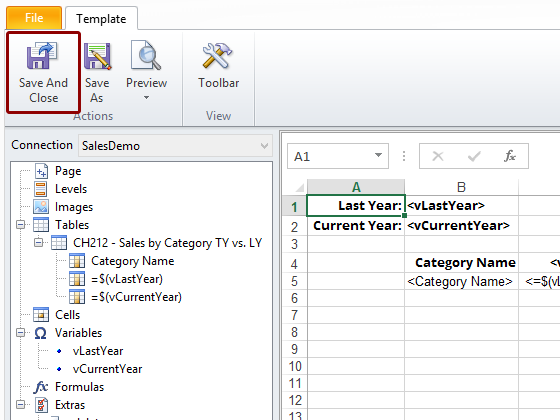
Click on the Save and Close icon in the Actions group.
Save and Close Report