Unlock a world of possibilities! Login now and discover the exclusive benefits awaiting you.
- Qlik Community
- :
- Forums
- :
- Analytics
- :
- App Development
- :
- Re: Creating Graphics comparative Date, similar Go...
- Subscribe to RSS Feed
- Mark Topic as New
- Mark Topic as Read
- Float this Topic for Current User
- Bookmark
- Subscribe
- Mute
- Printer Friendly Page
- Mark as New
- Bookmark
- Subscribe
- Mute
- Subscribe to RSS Feed
- Permalink
- Report Inappropriate Content
Creating Graphics comparative Date, similar Google Analytics
Edited by Community Team member:
Please post your topics in English unless you post them in a language specific section.
Post translated by Google translate.
---
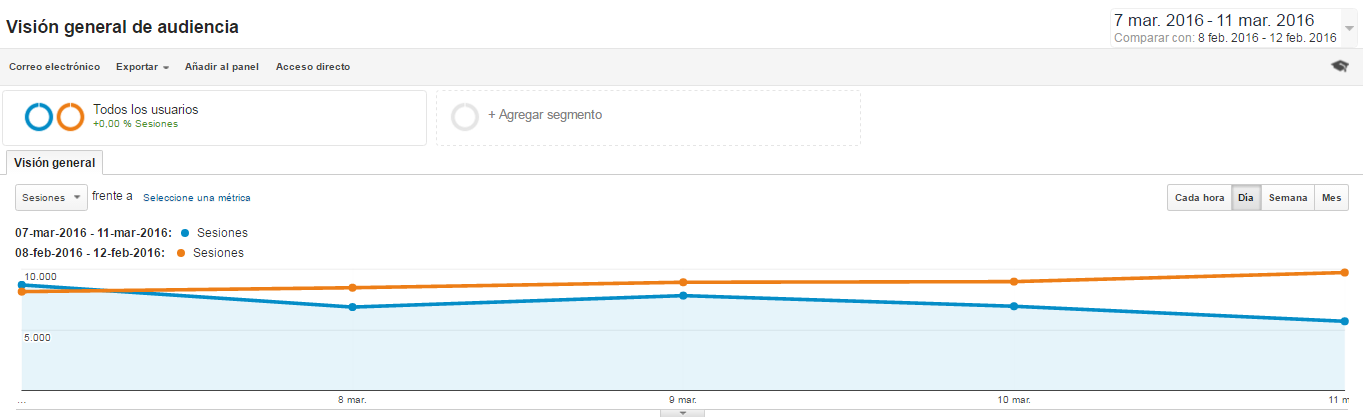
Good morning !! community, I want to make on the same graph a comparison over time, as does Google Analytics, for example, want to buy sales from Monday to Friday 03/07/2016 Monday 03/11/2016 with 08 / 02/2016 Friday 02.12.2016 (the same week in February).
How can I do this?
Can you close a filter on a single graph?
Deputy example in Analytics, as it is I want to do in Q Sense
Thank you very much, Greetings!
- Mark as New
- Bookmark
- Subscribe
- Mute
- Subscribe to RSS Feed
- Permalink
- Report Inappropriate Content
You can use alternate states to do that. Currently you need an extension to create the alternate states. See this discussion for an example: Comparative Analysis - Alternate States with Qlik Sense
talk is cheap, supply exceeds demand
- Mark as New
- Bookmark
- Subscribe
- Mute
- Subscribe to RSS Feed
- Permalink
- Report Inappropriate Content
Thank you very much Gysbert, now, I ask you, how I do for download the extension "Set Object State" and "Alternate State Actions" ?
- Mark as New
- Bookmark
- Subscribe
- Mute
- Subscribe to RSS Feed
- Permalink
- Report Inappropriate Content
Already solved. I found where lower it and put it in the extensions. Thanks Gysbert
- Mark as New
- Bookmark
- Subscribe
- Mute
- Subscribe to RSS Feed
- Permalink
- Report Inappropriate Content
You're welcome. Good luck!
talk is cheap, supply exceeds demand