Unlock a world of possibilities! Login now and discover the exclusive benefits awaiting you.
- Qlik Community
- :
- Forums
- :
- Analytics
- :
- New to Qlik Analytics
- :
- Re: Sorting issue
- Subscribe to RSS Feed
- Mark Topic as New
- Mark Topic as Read
- Float this Topic for Current User
- Bookmark
- Subscribe
- Mute
- Printer Friendly Page
- Mark as New
- Bookmark
- Subscribe
- Mute
- Subscribe to RSS Feed
- Permalink
- Report Inappropriate Content
Sorting issue
Hi,
I have a data set like below.
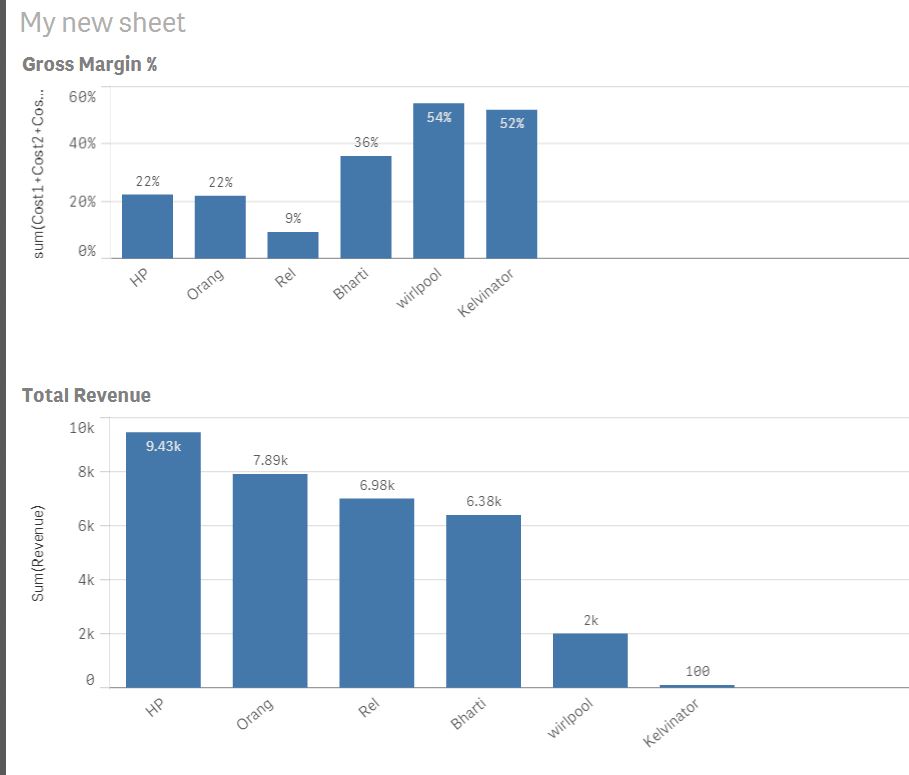
I want a bar graph and want to limit bars to show only 3 bars with a condition when the gross marging% is higher than 20%.
and secondly i want to sort those bars with an expression - Sum(Revenue).
Gross Margin %(Measurement) - > (Sum(Cost1)+Sum(Cost2)+sum(Cost3))/sum(Revenue)
CustomerName (Dimension) - CustomerName
| Country | Customers | Revenue | Cost1 | Cost2 | Cost3 |
| Ind | Orang | 100 | 43 | 0 | 7 |
| Rus | Bharti | 2000 | 54 | 545 | 34 |
| Ind | Rel | 100 | 12 | 3 | 4 |
| Rus | HP | 500 | 54 | 11 | 35 |
| America | Orang | 2343 | 454 | 333 | 35 |
| EMEA | Bharti | 3423 | 755 | 534 | 3 |
| Pak | Rel | 645 | 76 | 34 | 4 |
| Bang | HP | 5477 | 343 | 435 | 345 |
| America | Kelvinator | 100 | 45 | 4 | 3 |
| EMEA | wirlpool | 2000 | 687 | 43 | 354 |
| Pak | Orang | 100 | 23 | 3 | 4 |
| Bang | Bharti | 500 | 242 | 32 | 23 |
| EMEA | Rel | 6000 | 464 | 32 | 2 |
| My | Orang | 5345 | 432 | 342 | 54 |
| Afganistan | Bharti | 453 | 34 | 23 | 4 |
| Lebanon | Rel | 234 | 3 | 4 | 6 |
| Afganistan | HP | 3454 | 435 | 343 | 111 |
Regards
Prasanta
- « Previous Replies
- Next Replies »
- Mark as New
- Bookmark
- Subscribe
- Mute
- Subscribe to RSS Feed
- Permalink
- Report Inappropriate Content
Do you have sample you can share?
- Mark as New
- Bookmark
- Subscribe
- Mute
- Subscribe to RSS Feed
- Permalink
- Report Inappropriate Content
please find attached the qvf file.
In the first bar graph, the sorting order is ok. I just want to show the first two customer (HP and Orange)
- Mark as New
- Bookmark
- Subscribe
- Mute
- Subscribe to RSS Feed
- Permalink
- Report Inappropriate Content
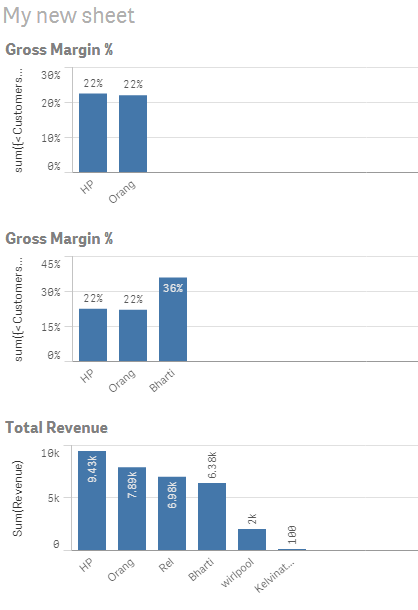
Maybe like this?
- Mark as New
- Bookmark
- Subscribe
- Mute
- Subscribe to RSS Feed
- Permalink
- Report Inappropriate Content
can you please share the complete details, how you did it.
- Mark as New
- Bookmark
- Subscribe
- Mute
- Subscribe to RSS Feed
- Permalink
- Report Inappropriate Content
if you have used set analysis by entering customer names, then it will not work for me as i have many customers and i cant enter their names in set analysis
- Mark as New
- Bookmark
- Subscribe
- Mute
- Subscribe to RSS Feed
- Permalink
- Report Inappropriate Content
Goto Dimensions, there you can see Limitation. It will be in No limitation. select the dropdown arrow and Select exact value or Relative and give the limitation.
For sorting, Goto Sorting, then Drag the Dimension to the Top and uncheck the auto sort and select sort by expression. then enter the expression.
- Mark as New
- Bookmark
- Subscribe
- Mute
- Subscribe to RSS Feed
- Permalink
- Report Inappropriate Content
The QVF is attached to my previous post, just go through the settings of the charts.
It's mainly a matter of
1) limit the customers using set analysis (but not listing the explicite values, it's a dynamic search based on Revenue rank and margin threshold)
If you want to have the set analysis consider your current customer selection, you can add the intersection operator * to the field modifier (I've done only this change in attached document).
2) Sorting the customers by Sum(Revenue) desc
3) disabling add-on / data handling option 'Show NULL/zero values'
- Mark as New
- Bookmark
- Subscribe
- Mute
- Subscribe to RSS Feed
- Permalink
- Report Inappropriate Content
Amith,
I think the problem is that t is required to consider the sorting when limiting to top3 dimension values.
I couldn't make this work by just using the dimension limit option, since it will look at the expression to limit the values only.
If you could make it work, please post a sample QVF.
- Mark as New
- Bookmark
- Subscribe
- Mute
- Subscribe to RSS Feed
- Permalink
- Report Inappropriate Content
this is working. but i am not able to identify, how you limit the bars to 2 in your first bar chart.
But anyway many thanks this set analysis is perfectly working as per my requirement.
- « Previous Replies
- Next Replies »