Unlock a world of possibilities! Login now and discover the exclusive benefits awaiting you.
- Qlik Community
- :
- Forums
- :
- Analytics
- :
- App Development
- :
- How to plot the bar only 1 bar per year ?
- Subscribe to RSS Feed
- Mark Topic as New
- Mark Topic as Read
- Float this Topic for Current User
- Bookmark
- Subscribe
- Mute
- Printer Friendly Page
- Mark as New
- Bookmark
- Subscribe
- Mute
- Subscribe to RSS Feed
- Permalink
- Report Inappropriate Content
How to plot the bar only 1 bar per year ?
Hi All
Table 1 have stock amount by month from 1996 Jan till 2016 march.
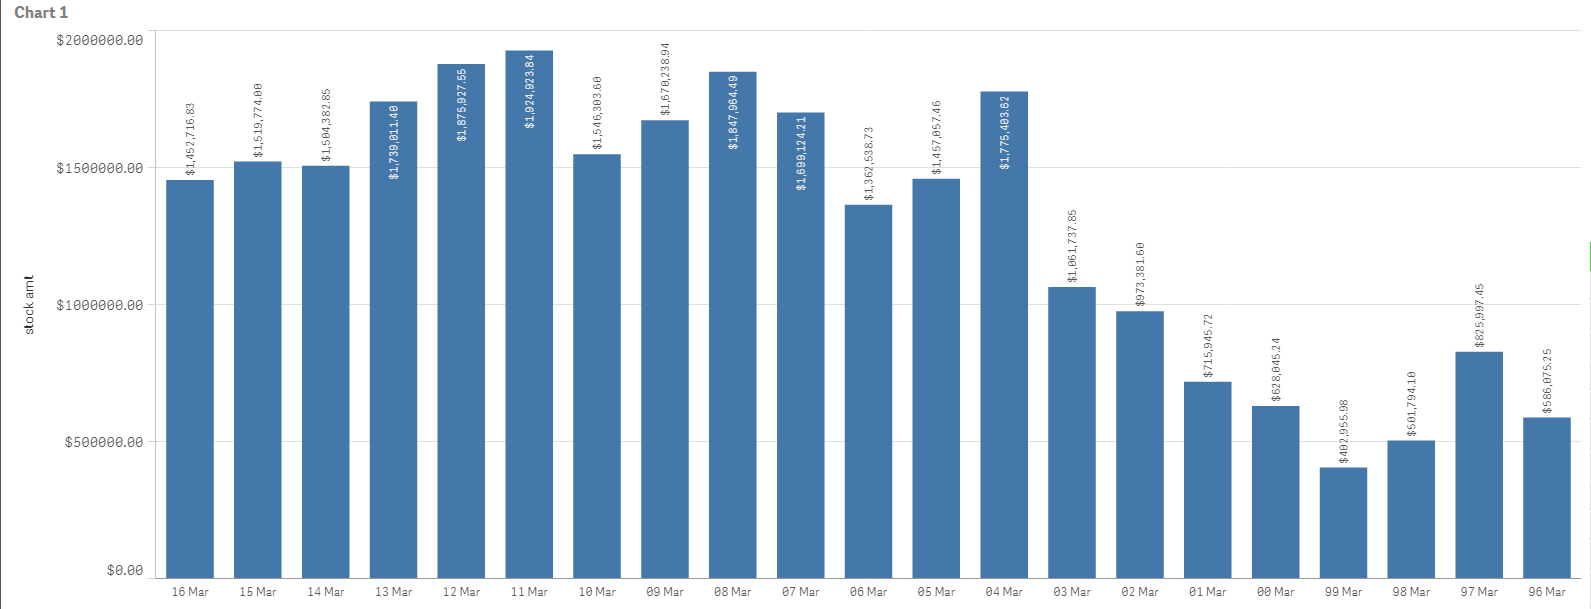
Chart 1 shown the bar chart for stock amount from 1996 Jan till 2016 March.
My question is how to make the chart 1 to display average stock for only every mach ?
Meaning it will display bar show as following :-
2016 march
2015 march
2014 march
and so on...
Paul
- « Previous Replies
-
- 1
- 2
- Next Replies »
Accepted Solutions
- Mark as New
- Bookmark
- Subscribe
- Mute
- Subscribe to RSS Feed
- Permalink
- Report Inappropriate Content
Try this:
Money(
Only({<year, month = {"$(=Max({<year = {$(=Max(year))}>}month))"}>}Aggr(RangeSum(
Above(RangeSum(Above(Sum({<year, month , GL_CODE = {50010}>}[Amount]*1), 0, RowNo()))),
-Sum({<GL_CODE = {50010}>}TOTAL Aggr(Sum({<year, month, GL_CODE = {50010}>}[Amount]*1), YearMonth))), (YearMonth, (NUMERIC, DESCENDING))))
, $(vMoneyFormatK_GL))
- Mark as New
- Bookmark
- Subscribe
- Mute
- Subscribe to RSS Feed
- Permalink
- Report Inappropriate Content
my QVF
- Mark as New
- Bookmark
- Subscribe
- Mute
- Subscribe to RSS Feed
- Permalink
- Report Inappropriate Content
Paul, not sure I understand what you are trying to do my friend. Can you may be elaborate a little more please?
- Mark as New
- Bookmark
- Subscribe
- Mute
- Subscribe to RSS Feed
- Permalink
- Report Inappropriate Content
Hi sunny
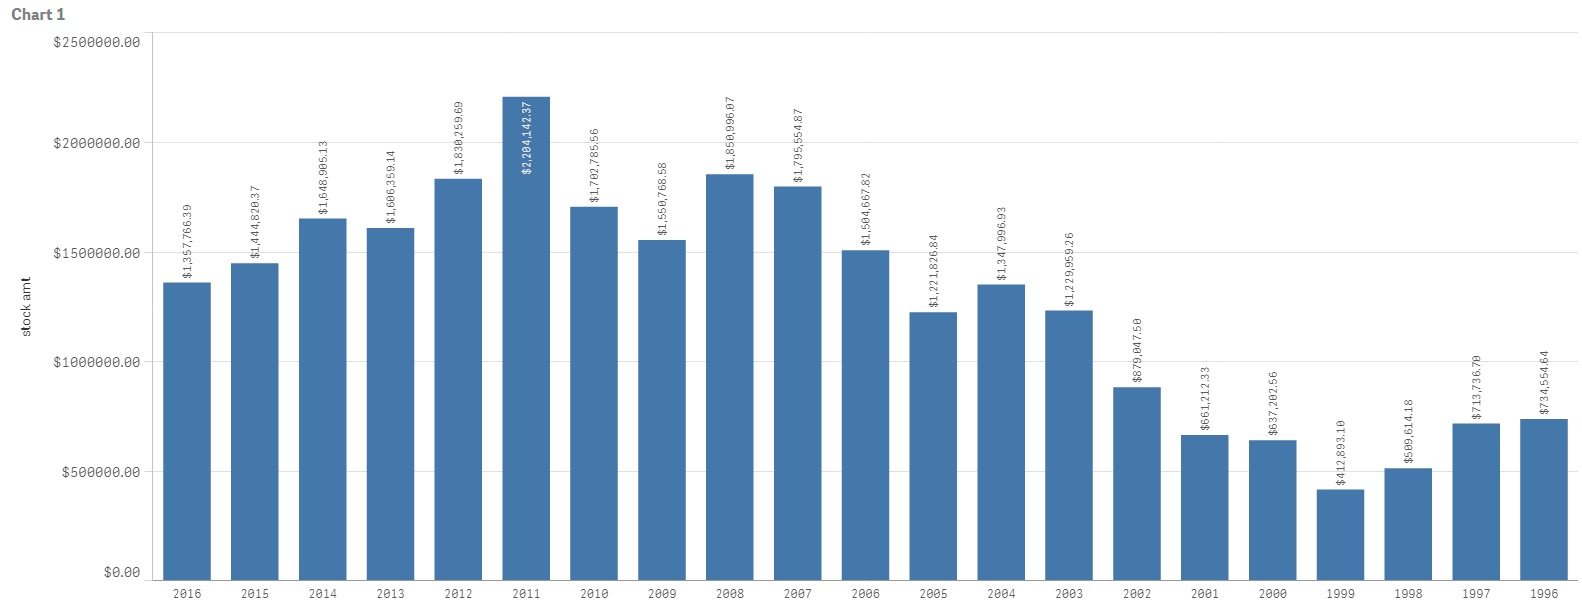
I want to show only 26 bar instead of 26*12 bar.
Meaning it will display every year only March sales . Since now my data max month = March
So that I can compare sales by year.
Alternative if can compute the yearly stock amount even more better.
Meaning sum of 2016 divide by 3 , show a bar for 2016.
And sum of 2015 stock amount divide by 12 , show 1 bar .
My Objective is to display stock trend amount by month.
Paul
Sent from my iPhone
- Mark as New
- Bookmark
- Subscribe
- Mute
- Subscribe to RSS Feed
- Permalink
- Report Inappropriate Content
Try this:
Money(
Only({<year, month = {"$(=Max({<year = {$(=Max(year))}>}month))"}>}Aggr(RangeSum(
Above(RangeSum(Above(Sum({<year, month , GL_CODE = {50010}>}[Amount]*1), 0, RowNo()))),
-Sum({<GL_CODE = {50010}>}TOTAL Aggr(Sum({<year, month, GL_CODE = {50010}>}[Amount]*1), YearMonth))), (YearMonth, (NUMERIC, DESCENDING))))
, $(vMoneyFormatK_GL))
- Mark as New
- Bookmark
- Subscribe
- Mute
- Subscribe to RSS Feed
- Permalink
- Report Inappropriate Content
For yearly, I would need to know what the expected output is so that I can have a goal in mind 
- Mark as New
- Bookmark
- Subscribe
- Mute
- Subscribe to RSS Feed
- Permalink
- Report Inappropriate Content
Hi sunny
Average stock amount by year :-
2016 = 1.668 million
2017 = 1.755 million
Basically I sum up all the stock amount for 2015 divide by 12. This will give me average stock amount for 2015. That go same with the rest of the year.
For March 2016 I need to decide by 3 since it is only 3 month.
Sent from my iPhone
- Mark as New
- Bookmark
- Subscribe
- Mute
- Subscribe to RSS Feed
- Permalink
- Report Inappropriate Content
Is the dimension Year here?
Numbers are slightly different then what you were seeking, but can you check this (seems to match if I add each month number and divide it by number of months in that year)
- Mark as New
- Bookmark
- Subscribe
- Mute
- Subscribe to RSS Feed
- Permalink
- Report Inappropriate Content
Hi Sunny
Look like the average amount is wrong compare with my manually compute average amount.
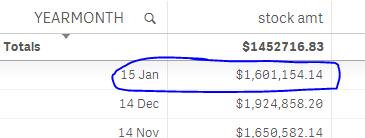
Alternative , can you take Jan amount add Dec amount and get the average amount. As accounting people compute average stock amount using this approach. meaning :-
2015 Jan = 1.91 million
2015 Dec = 1.61 million
Average stock amount = (1.91 + 1.61 ) /2 = 1.76
Paul
- Mark as New
- Bookmark
- Subscribe
- Mute
- Subscribe to RSS Feed
- Permalink
- Report Inappropriate Content
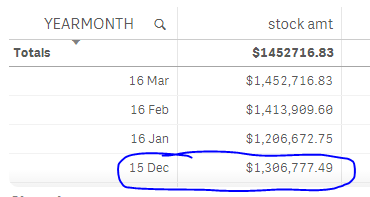
I see 1,306,777.49 for 15 Dec and 1,601,154.14 for 15 Jan. How are you calculating the numbers 2015 Jan and 2015 Dec numbers on your end?
Additionally how will you calculate the average for 2016 where dec is not available yet?
- « Previous Replies
-
- 1
- 2
- Next Replies »