Unlock a world of possibilities! Login now and discover the exclusive benefits awaiting you.
- Qlik Community
- :
- Forums
- :
- Analytics
- :
- New to Qlik Analytics
- :
- Re: can i set global colour for the different char...
- Subscribe to RSS Feed
- Mark Topic as New
- Mark Topic as Read
- Float this Topic for Current User
- Bookmark
- Subscribe
- Mute
- Printer Friendly Page
- Mark as New
- Bookmark
- Subscribe
- Mute
- Subscribe to RSS Feed
- Permalink
- Report Inappropriate Content
can i set global colour for the different charts based on the value of the dimension?
How can i set global colour for the different charts based on the value of the dimension?
For example, I have data with the dimension region. The are 4 values in region - North, South, East and West. I want all belonging to the North region to be a colour, all to the South colour to be another colour and so on.
Thank you!
- « Previous Replies
-
- 1
- 2
- Next Replies »
- Mark as New
- Bookmark
- Subscribe
- Mute
- Subscribe to RSS Feed
- Permalink
- Report Inappropriate Content
- Mark as New
- Bookmark
- Subscribe
- Mute
- Subscribe to RSS Feed
- Permalink
- Report Inappropriate Content
One simple way I have found to force the colours to be the same on all of your charts for the same dimension is to tick the Persistent Colors tickbox on the Colours tab but you must do this on all of your charts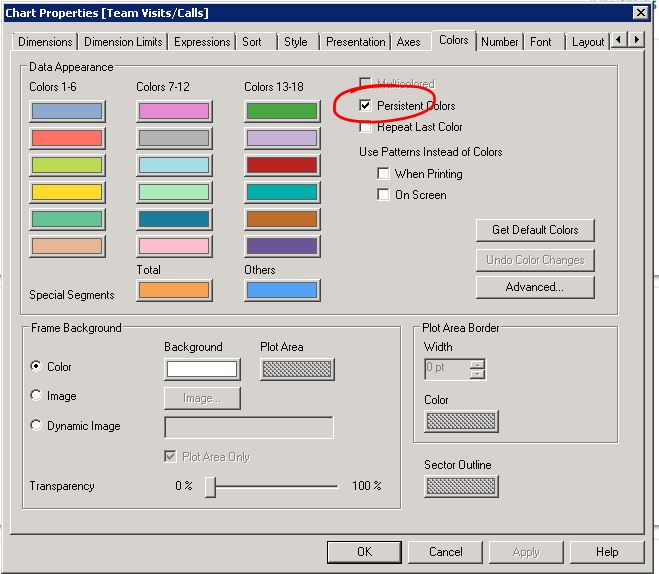
Hope this helps you
Helen
- Mark as New
- Bookmark
- Subscribe
- Mute
- Subscribe to RSS Feed
- Permalink
- Report Inappropriate Content
In the 'Background Color', try the below expression.
Color(FieldIndex('Region',[Region]))
- Mark as New
- Bookmark
- Subscribe
- Mute
- Subscribe to RSS Feed
- Permalink
- Report Inappropriate Content
Hey Saran -
I have no seen this before. Would you be able to share a sample to show how this works?
- Mark as New
- Bookmark
- Subscribe
- Mute
- Subscribe to RSS Feed
- Permalink
- Report Inappropriate Content
Hi Wei Chong Tan! Do as Helen Chapman wrote and it will works.
- Mark as New
- Bookmark
- Subscribe
- Mute
- Subscribe to RSS Feed
- Permalink
- Report Inappropriate Content
Hello Wei,
What product are you using, I see the replies here are for QlikView, but you posted in the Qlik Sense forums.
With Qlik Sense, you may be able to this using the color by expression capability. Let me take a look and I will get back to you.
Please mark the appropriate replies as CORRECT / HELPFUL so our team and other members know that your question(s) has been answered to your satisfaction.
Regards,
Mike Tarallo
Qlik
Mike Tarallo
Qlik
- Mark as New
- Bookmark
- Subscribe
- Mute
- Subscribe to RSS Feed
- Permalink
- Report Inappropriate Content
Hi Wei as a Follow-up see attached .qvf if using Qlik Sense.
I created a new field in the load script:
..
..
[City] & [Country] as CityCounty,
..
..
And then in the color by expression used this as an example:
if(WildMatch(CityCounty,'*United States*','*Germany*','*Brazil*','*United Kingdom*')>0,
PICK(WildMatch(CityCounty,'*United States*','*Germany*','*Brazil*','*United Kingdom*'),blue(),red(),yellow(),green()))

Mike Tarallo
Qlik
- Mark as New
- Bookmark
- Subscribe
- Mute
- Subscribe to RSS Feed
- Permalink
- Report Inappropriate Content
Hi all,
thank you all for the reply. I am using qlik sense so most of the solutions here will not work for me. Nonetheless, thank you all so much for sharing! Now I know what to do if I were to use qlik view in the future.
@Michael Tarallo. Thank you! That works! But was just wondering if there is a global settings which I could set it and not have to write the expression for all the charts. Reason being most of my charts are broken down by the categories and I want all their collour to be consistent.
Thank you!
- Mark as New
- Bookmark
- Subscribe
- Mute
- Subscribe to RSS Feed
- Permalink
- Report Inappropriate Content
Hi Wei,
You can make use of a colour expression to achieve this. And to make it more easy to manage the colours being used across multiple dashboards, you can have a colours table in your data model which can be used to easily alter the colours of all the visualizations easily.
- « Previous Replies
-
- 1
- 2
- Next Replies »