Unlock a world of possibilities! Login now and discover the exclusive benefits awaiting you.
- Qlik Community
- :
- Forums
- :
- Analytics
- :
- App Development
- :
- Re: Ranking with sub-query
- Subscribe to RSS Feed
- Mark Topic as New
- Mark Topic as Read
- Float this Topic for Current User
- Bookmark
- Subscribe
- Mute
- Printer Friendly Page
- Mark as New
- Bookmark
- Subscribe
- Mute
- Subscribe to RSS Feed
- Permalink
- Report Inappropriate Content
Ranking with sub-query
I've been wrestling with this problem without success for some time. We have a data set of items to be sold which looks something like:
| UniqueRef | ItemType | PreferredRank | OrderWeek |
|---|---|---|---|
| FR3343 | A | 12 | 2016-05-16 |
| FR3343 | B | 11 | 2016-05-09 |
| KI4325 | G | 10 | NULL |
| PL4382 | A | 9 | 2016-05-16 |
| FR3456 | B | 8 | NULL |
| FR7256 | C | 7 | NULL |
| PL8365 | G | 6 | 2016-05-09 |
| PL2555 | A | 5 | 2016-05-16 |
| MB8012 | A | 4 | 2016-05-09 |
| MB8012 | F | 3 | 2016-05-09 |
| MB8032 | G | 2 | NULL |
| PL8433 | A | 1 | 2016-05-09 |
Here there is a [PreferredRank] field, where a higher rank means we’d ideally like to sell it earlier. This is a unique field in the data which goes from 1 up to N (the number of items in the data).
The [OrderWeek] field shows if the item is present in an order which is due to ship in that particular week.
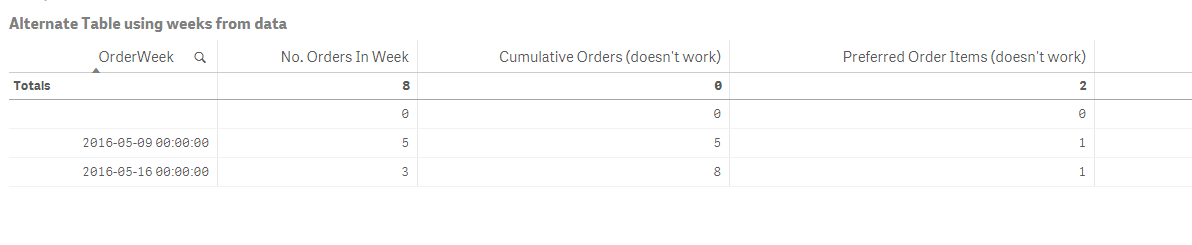
What I’m trying to achieve from this data is a summary table by order week that looks something like:
| Week | No. Orders In Week | Cumulative Orders | Preferred Item Orders |
|---|---|---|---|
| 2016-05-09 | 5 | 5 | 1 |
| 2016-05-16 | 3 | 8 | 1 |
| etc |
I can create the first two columns but it’s the third I’m struggling with. To explain what this column means:
To calculate the [Preferred Item Orders] by hand we’d carry out two steps in a calculation:
- Look at how many orders are present in total for the particular week (e.g there are 5 for week 2016-05-09 in the above example).
- Check that many items in descending order of [PreferredRank] in the dataset, counting how many of them are due for sale in that same week.
For example, for the week 2016-05-09 this would mean looking at the top 5 items (with [PreferredRank] = 12 down to 😎 and counting how many had an [OrderWeek] = 2016-05-09. In this case there is just the one.
In the case of the second week (2016-05-16) this would mean instead of looking at the top 5 items by RankNo, we would instead look at the top 3 because that’s how many total orders there are in that week.
I've tried constructing an expression in many different ways but it’s this dynamic sub—query that’s giving me problems making one that works.
Am I overlooking something obvious here or is this perhaps something that’s not possible to achieve?
From reading elsewhere on this forum I understand that it may not be possible to use a dollar expansion over a dimension (as it’s just calculated once rather than per line as we would require here?) . Hence I'd be happy creating even multiple measures, one per week if that were necessary.
Hopefully I've managed to explain the problem sufficiently - I've also attached an example .qvf file with the same data.
Many Thanks.
Accepted Solutions
- Mark as New
- Bookmark
- Subscribe
- Mute
- Subscribe to RSS Feed
- Permalink
- Report Inappropriate Content
Michael is right, you need some kind of Aggr here. Try this
Dimension:
OrderWeek
Expressions
1) Sum(HasOrderFlag)
2) RangeSum(Above(Sum([HasOrderFlag]), 0, RowNo()))
3) Sum({<UniqueRef = {"=(Max(TOTAL PreferredRank) - Aggr(NODISTINCT Sum([HasOrderFlag]), OrderWeek)) < PreferredRank"}>}if([OrderWeek] = Week, [HasOrderFlag],0))
This seems to be working for the sample, but test it out for your original data and see if this gets you to what you need
- Mark as New
- Bookmark
- Subscribe
- Mute
- Subscribe to RSS Feed
- Permalink
- Report Inappropriate Content
Hello Ian,
I may not be the best expression writer when it comes to Qlik, but what it sounds like you want to do is use the AGGR() function. Possibly using the AGGR() function along with RANK().
Check out this brief video to see if I am going in the right direction:
Hello Other community members, please help out Ian as well if you have something available that is inline with his need.
Please mark the appropriate replies as CORRECT / HELPFUL so our team and other members know that your question(s) has been answered to your satisfaction.
Regards,
Mike Tarallo
Qlik
Mike Tarallo
Qlik
- Mark as New
- Bookmark
- Subscribe
- Mute
- Subscribe to RSS Feed
- Permalink
- Report Inappropriate Content
Michael is right, you need some kind of Aggr here. Try this
Dimension:
OrderWeek
Expressions
1) Sum(HasOrderFlag)
2) RangeSum(Above(Sum([HasOrderFlag]), 0, RowNo()))
3) Sum({<UniqueRef = {"=(Max(TOTAL PreferredRank) - Aggr(NODISTINCT Sum([HasOrderFlag]), OrderWeek)) < PreferredRank"}>}if([OrderWeek] = Week, [HasOrderFlag],0))
This seems to be working for the sample, but test it out for your original data and see if this gets you to what you need
- Mark as New
- Bookmark
- Subscribe
- Mute
- Subscribe to RSS Feed
- Permalink
- Report Inappropriate Content
That's fantastic thank you. Many Thanks.