Unlock a world of possibilities! Login now and discover the exclusive benefits awaiting you.
- Qlik Community
- :
- All Forums
- :
- QlikView App Dev
- :
- Re: Top N statement
- Subscribe to RSS Feed
- Mark Topic as New
- Mark Topic as Read
- Float this Topic for Current User
- Bookmark
- Subscribe
- Mute
- Printer Friendly Page
- Mark as New
- Bookmark
- Subscribe
- Mute
- Subscribe to RSS Feed
- Permalink
- Report Inappropriate Content
Top N statement
Hello experts,
I want to create a table instead of chart including top n sales vaule,
example-origial table:
| Customers | China | USA | Germany | Singarpore | Total |
|---|---|---|---|---|---|
AAA | 10 | 12 | 15 | 9 | 46 |
| BBB | 8 | 10 | 6 | 9 | 33 |
| CCC | 5 | 4 | 8 | 11 | 28 |
| DDD | 12 | 9 | 6 | 3 | 29 |
| EEE | 15 | 13 | 16 | 17 | 61 |
expecting result - for top 3 sales (based on Total) :
| Customers | China | USA | Germany | Singarpore | Total |
|---|---|---|---|---|---|
| EEE | 15 | 13 | 16 | 17 | 61 |
AAA | 10 | 12 | 15 | 9 | 46 |
| BBB | 8 | 10 | 6 | 9 | 33 |
Thanks.
Jessica
- Mark as New
- Bookmark
- Subscribe
- Mute
- Subscribe to RSS Feed
- Permalink
- Report Inappropriate Content
Hi Jessica,
Use a Chart > Straight Table instead of a Table Box and it works the same as a bar chart.
Chart Properties > Dimension Limits tab > Limits > Check the Restrict which values are displayed using the first expressions button and select Show only > Largest n values. Then you can un-check the Show Others box if you want.
- Mark as New
- Bookmark
- Subscribe
- Mute
- Subscribe to RSS Feed
- Permalink
- Report Inappropriate Content
Hi,
I know how to handle with Chart, but have to use table. Thanks.
Regards,
Jessica
- Mark as New
- Bookmark
- Subscribe
- Mute
- Subscribe to RSS Feed
- Permalink
- Report Inappropriate Content
Fair enough. It can be done but I don't know why you would want to do it this way as it is needlessly complicated.
As a Table Box can only return data as it is presented in a table, you are going to need to figure out what are the top 3 customer in the script. As I'm not sure how the data is loaded, I'm going to assume that it is loaded as presented above (i.e. with totals already known in the script).
The first thing you're going to need to do is work out the rank using ORDER BY and the RowNo() function in the script. After loading your data, I loaded it again as follows:
Table:
LOAD RowNo() AS Rank,
     Customers,
     China,
     USA,
     Germany,
     Singarpore,
     Totals
Resident
Table_tmp
WHERE RowNo() ❤️
Order By Totals Desc;

DROP Table Table_tmp;
This will only load the top three values into the QVW and that is how you can display it in a Table Box. If you don't know the Totals, then you are going to need to work that out in the script too, which adds another layer of complication. In summary your app will be needlessly clunky.
You can see my attached example. It contains the Chart Table and Table Box approach.
- Mark as New
- Bookmark
- Subscribe
- Mute
- Subscribe to RSS Feed
- Permalink
- Report Inappropriate Content
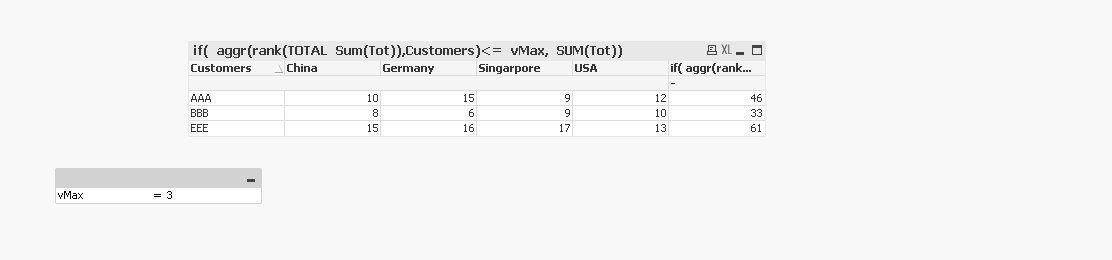
You can first create a TopN variable first, and then in "Dimension Limits tab" change it to top N. And then you can use a inputbox or slider to dynamic show the top N sales row.
- Mark as New
- Bookmark
- Subscribe
- Mute
- Subscribe to RSS Feed
- Permalink
- Report Inappropriate Content
Hi ,
Please find attached solution.
Vikas
If the issue is solved please mark the answer with Accept as Solution & like it.
If you want to go quickly, go alone. If you want to go far, go together.
- Mark as New
- Bookmark
- Subscribe
- Mute
- Subscribe to RSS Feed
- Permalink
- Report Inappropriate Content
Hi ,
I hope this is helpful to you
T1:
load * Inline [
Customers, China, USA, Germany ,Singarpore, Total
AAA, 10 ,12 ,15, 9, 46
BBB, 8 ,10, 6, 9, 33
CCC, 5, 4 ,8 ,11, 28
DDD ,12 ,9, 6, 3 ,29
EEE ,15, 13, 16, 17 ,61
];
NoConcatenate
T2:
load *,
RowNo() as rank
Resident T1 Where RowNo()<3
order by Total desc;
DROP table T1;
Regards,
Mahesh