Unlock a world of possibilities! Login now and discover the exclusive benefits awaiting you.
Recent Discussions
-
Calculate average per month based on the count of months
Hi there,I'm trying to calculate an a !verage per month (= the sum of ... divided by number of months available) but it doesn't work. Anyone any sugge... Show MoreHi there,
I'm trying to calculate an a !verage per month (= the sum of ... divided by number of months available) but it doesn't work. Anyone any suggestions what I'm doing wrong?
If (in a text box) I apply the calculation "count(distinct(Month))" it gives me the number "2" which is correct since there are only two months of data available. However, applying the same expression in a pivot table doesn't work.
Much appreciated if someone can guide me into the right direction.
Cheers!

-
How to check whether certain record timestamps overlap...
Hi,I have been given a set of data that is being extracted from several vending machines.The data contains information on coin shortages. Basically, e... Show MoreHi,
I have been given a set of data that is being extracted from several vending machines.The data contains information on coin shortages. Basically, every time a vending machine is low on change, it logs error code A214. When the change is replenished, it logs code A215.
Vending machines are located in several locations and each location can have multiple vending machines.
I have been tasked to create an application that records occurrences when all vending machines on site (per location) are low on change. I want to be able to create a report output that shows something similar to the below:
===========================================================
Example Report
===========================================================
Location Start_Date End_Date
Site1 01/01/2016 14:06:01 01/01/2016 20:45:21
Site2 01/05/2016 11:16:01 01/05/2016 18:23:14
Site2 01/05/2016 20:23:11 02/05/2016 09:00:01
Note: - The report must check for the low change status with all machines at the same location
- There could be multiple change shortages throughout the same day, these must all be recorded separately.
===========================================================
Sample Data
===========================================================
I have modelled the data to a point where I am able to construct a table with a row of data for each occurrence where a single machine is short on change (and when its replenished again).See below for an example.
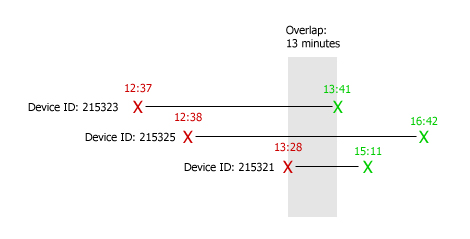
Location DeviceID EventDec StartDateTime EndDateTime Site1 215320 A214 01/01/2016 00:04 01/01/2016 12:11 Site1 215328 A215 01/01/2016 15:04 01/01/2016 19:11 Site 2 215323 A214 01/01/2016 12:37 01/01/2016 13:41 Site 2 215325 A214 01/01/2016 12:38 01/01/2016 16:42 Site 2 215321 A214 01/01/2016 13:28 01/01/2016 15:11 Site 3 215341 A214 01/01/2016 13:28 01/01/2016 15:11 Site 3 214321 A214 01/01/2016 16:28 01/01/2016 17:11 Site 3 211321 A214 01/01/2016 18:28 01/01/2016 22:11 Note: The above data shows that Site 2 has had an overlap occurrence of 13 minutes between 13:28 (Device 215321 first shortage) and 13:41 (Device 215323 first replenishment). Device 215325 was also low on change between this time frame. See below for an illustration of this.
Thanks in advance.
Graham
===========================================================
EDIT:
===========================================================
I have also attached an example of the QVW file.
-
Set Analysis in include.qvs file
Hi all,How can I use the expression bellow in include.qvs file?SET vLast12Months = Sum ({<[Ano Mes Retorno] = {">=$(=date(Max(addmonths(today(),-12))... Show MoreHi all,
How can I use the expression bellow in include.qvs file?
SET vLast12Months = Sum ({<[Ano Mes Retorno] = {">=$(=date(Max(addmonths(today(),-12)),'YYYYMM'))"}>}[Valor Realizado Cob - Coop]);
When executed, the variable vLast12Months appears like this in the .qvw file:
"Sum ({<[Ano Mes Retorno] = {">="}>}[Valor Realizado Cob - Coop])"
Thanks
Rafael
-
nprinting may 2026 fails for high dpi report output, not for normal
hello, since may 2026 version of nprinting, my reports in high quality fail to generate with an error "object reference not set to an instance... "the... Show Morehello,
since may 2026 version of nprinting, my reports in high quality fail to generate with an error "object reference not set to an instance... "
the same report in normal quality generates without any problem...
any suggestions ?
already increased the rendering and scheduling timeouts
Qlik NPrinting #may2026 @Ruggero_Piccoli

-
QlikView Geoanalytics map for Austria/area layer for postal codes
Hello, My use case: I need to highlight all Austrian postal codes (area layer) in a QlikView Geoanalytics map. I tried different ways, but at the mom... Show MoreHello,
My use case: I need to highlight all Austrian postal codes (area layer) in a QlikView Geoanalytics map. I tried different ways, but at the moment I have a huge part not colored at all.
- Taking into consideration Postal Code there is just the Eastern and Northern Part (Lower Austria and Upper Austria) marked in red (standard color for the moment).
- If I use the names of the locations, its either mixing up postal codes, communitiy and regions - so not working.
- Using the community code is not working neither for part of Austrian area.
So for me...mission failed and I really do not understand why! I hope to find somebody here having experience with Austrian maps and is able to support me here.
Thanks in advance!
Gerlinde
-
Stacked Bar Color expressions per Measure
Hello, I am trying to create a visual in qlik sense that is a stacked bar chart where there are three measures. I want each measure to be a static col... Show MoreHello, I am trying to create a visual in qlik sense that is a stacked bar chart where there are three measures. I want each measure to be a static color say measure one is revenue (minus profit and expenses) and is to be grey, measure two is profit and is to be green, and measure three is to be red. These measures are calculated within the chart.
Thank you!
-
qlikview script or chat expression needed.
INPUT:Column1Column2Column3Column4Test1Test228557914030973044605761190578486119057848611905784828557914030973044605761190578486119057848-2855791403097... Show MoreINPUT:
Column1
Column2
Column3
Column4
Test1
Test2
2855791
40309730
446057
6119057848
6119057848
6119057848
2855791
40309730
446057
6119057848
6119057848
-
2855791
40309730
446057
6119057848
6119057848
-
2855791
40309730
446057
6119057848
6119057848
-
2855791
40309730
446057
6119057848
6119057848
-
2855791
40309730
446057
6119057848
-
6119057848
2855791
40309730
446057
6119057848
-
6119057848
2855791
40309730
446057
6119057848
-
6119057848
2855791
40309730
446057
6119057848
-
6119057848
2855791
40309730
446057
6119057848
-
6119057848
2855791
40309730
446057
6119057850
6119057850
6119057850
2855791
40309730
446057
6119057850
6119057850
-
2855791
40309730
446057
6119057850
6119057850
-
2855791
40309730
446057
6119057850
6119057850
-
2855791
40309730
446057
6119057850
6119057850
-
2855791
40309730
446057
6119057850
-
6119057850
2855791
40309730
446057
6119057850
-
6119057850
2855791
40309730
446057
6119057850
-
6119057850
2855791
40309730
446057
6119057850
-
6119057850
2855791
40309730
446057
6119057850
-
6119057850
OUTPUT REQUIRED FOR CHART EXPRESSION IN QLIKVIEW:
Column1
Column2
Column3
Column4
Test1
Test2
2855791
40309730
446057
6119057848
6119057848
6119057848
2855791
40309730
446057
6119057850
6119057850
6119057850
Till column 4 data from Table1, column1 , column2,column3 taken as key from Table 1 , Table2, Table3.
column4 value should match with Test1,Test2 or can be null. Table 2 and Table3 one field name is similar which contains the above values mentioned in the Test1 teast2. Alias field name1 & field name2
From Table 2 :Tast1 chart condition applied : if (sum(num( column4)=sum(num(field name1),field name1)
From Table3 :Tast2 chart condition applied : if (sum(num( column4)=sum(num(ffield name2,field name2)
I just wanted to show the missing value in the test1 and test2 corresponding to column4
-
Print Report - Timeout has been exceeded
Hi all,I've a strange issue.One of our customer has a .qvw with a button with "Print Report" action. When opened with QlikView Client, it works fine (... Show MoreHi all,
I've a strange issue.
One of our customer has a .qvw with a button with "Print Report" action. When opened with QlikView Client, it works fine (--> panel to choose the printer and then... print!), but opened in Access Point (either with Ajax and with IE Plugin) it immediateley gives a js alert with "Timeout has been exceeded" message. I inspected logs, restarted services, tried to add PDFPrintTimeoutInSeconds=120 in settings.ini, restarted IIS, lighted a candle to my favourite Saint... but nothing
 .
.The PDF generated is about 400Kb
 , so small, too...
The same .qvw, put in another QV Server, works fine. Another .qvw that in my QV Server works fine... there doesn't work.
Windows Server 2012
QV 11 SR 12
IIS as webserver
Anyone can help me?
Thanks in advance,
S.
-
NPrinting - Container Object unseen in Report
After generating a report on Nprinting, I realized that some of the objects are not present in the final PDF file. Specifically container objects, whi... Show MoreAfter generating a report on Nprinting, I realized that some of the objects are not present in the final PDF file. Specifically container objects, which I use to group together several objects in an organized way. This happens rather randomly, meaning that it has happened for some containers one day and for others in some other day, both on local and on server (Testing).
I would greatly appreciate any advice on how to solve this matter.
Thank you all in advance.
Regards.
-
create a report in Nprinting
HelloI want to create an Nprinting report not based on an existing table in Qlik appthe report is very simpleI want to add 4 dimensions and an express... Show MoreHello
I want to create an Nprinting report not based on an existing table in Qlik app
the report is very simple
I want to add 4 dimensions and an expression
I know that the expression is created in teh formulas node on the left
but how can I add dimensions to the report (excel format)
Kindly advise
also is there a way to reference a master measure in Nprinting? -
Nprinting report from scratch
Hellogot 3 dimensions in my Qlik sense app:Month, currency, scenarioI want to create the follwing simple report:MONTH CURRENCY SCENARIO2... Show MoreHello
got 3 dimensions in my Qlik sense app:
Month, currency, scenario
I want to create the follwing simple report:
MONTH CURRENCY SCENARIO
202601 EUR ACTUAL
202601 USD ACTUAL
202601 EUR BUDGET
202601 USD BUDGET202602 EUR ACTUAL
202602 USD ACTUAL
202602 EUR BUDGET
202602 USD BUDGET
...
I create 3 levels in Nprinting report editor as follows:Now I want to use these in the excel sheet:
which I used as follows:and the result is not as expected:
kindly advise on how to put the levels on the excel template
@Lech_Miszkiewicz -
Lease License QlikView without port 80
How to lease license without port 80? our connection to port 80 is blocked because of security reason, port 4747 and 443 is openI tried using qvp url,... Show MoreHow to lease license without port 80? our connection to port 80 is blocked because of security reason, port 4747 and 443 is open
I tried using qvp url, my qlikview desktop still personal edition :Connected to server OK, No reply received
Switching to HTTPS tunneling
Connected to server OK, Security settings denies access
Switching to HTTP tunneling
Connected to server OK, Negotiations Timed OutQlikView Version : 12.100
-
Is it possible to create custom admin roles? Ex: Document Administrators without...
We are trying to hand off more control to our business units and were curious if QlikView has the ability in the QMC to allow for custom admin roles. ... Show MoreWe are trying to hand off more control to our business units and were curious if QlikView has the ability in the QMC to allow for custom admin roles. I know there are options in Qlik Sense, but based on our experience, it seems as though you cannot setup a document admin without giving them the ability to modify (add/remove) users and/or groups from distribution on a task / QVW. Is that something that's possible or is there no such option?
-
QV 12.60 Developer Setup
Is there a configuration setting or AD group that determines who has access to develop in our QV 12.60 installation? Thanks much. -
NPrinting Pixel Perfect Error After May 2023 > February 2025 update.
I noticed today that some PixelPerfect reports fail to generate.The following error appears in the report log. I also get the same error when I open t... Show MoreI noticed today that some PixelPerfect reports fail to generate.
The following error appears in the report log. I also get the same error when I open the report in Designer and try to preview it.
WARN: error during report generation: 18: The type 'NPrinting.Reporting.ReportingApp.PixelPerfect.Controls.PPChart' exists in both 'c:\Program Files (x86)\NPrinting\Designer\libs\NPrinting.PixelPerfect.dll' and 'c:\Program Files\NPrintingServer\NPrinting\Engine\Qlik.Reporting.Legacy.PixelPerfect.dll' 19: The type 'NPrinting.Reporting.ReportingApp.PixelPerfect.Controls.PPChart' exists in both 'c:\Program Files (x86)\NPrinting\Designer\libs\NPrinting.PixelPerfect.dll' and 'c:\Program Files\NPrintingServer\NPrinting\Engine\Qlik.Reporting.Legacy.PixelPerfect.dll' 20: The type 'NPrinting.Reporting.ReportingApp.PixelPerfect.Controls.PPChart' exists in both 'c:\Program Files (x86)\NPrinting\Designer\libs\NPrinting.PixelPerfect.dll' and 'c:\Program Files\NPrintingServer\NPrinting\Engine\Qlik.Reporting.Legacy.PixelPerfect.dll' 21: The type 'NPrinting.Reporting.ReportingApp.PixelPerfect.Controls.PPChart' exists in both 'c:\Program Files (x86)\NPrinting\Designer\libs\NPrinting.PixelPerfect.dll' and 'c:\Program Files\NPrintingServer\NPrinting\Engine\Qlik.Reporting.Legacy.PixelPerfect.dll'I uninstalled Designer and then reinstalled it but still the same.
-
Access Denied. Membership of local security groups is missing. Please refer to t...
I accidentally deleted an account with administrator privileges of QVS from Windows users and lost the user information to access QMC. Therefore, when... Show MoreI accidentally deleted an account with administrator privileges of QVS from Windows users and lost the user information to access QMC.
Therefore, when I try to access the QMC, the following error message appears.
"Access Denied. Membership of local security groups is missing. Please refer to the manual for more information."
So, I checked the following post, When I navigate to Local Users and Groups > Groups in the Computer Management window, I do not see the QlikView Administrators group.
Solved: Access Denied. Membership of local security groups... - Qlik Community - 1123860
Is there any information on the standard administrator user in such a case?
-
Upgrading Feb 2024 SR1 To Feb 2024 SR4
Hi All,I've been trying to upgrade Nprinting Feb 2024 SR1 to SR4, but in most of the after making all the recommended steps, I execute the installer ... Show MoreHi All,
I've been trying to upgrade Nprinting Feb 2024 SR1 to SR4, but in most of the after making all the recommended steps, I execute the installer and instead of say "Upgrade" just says "Install".
If I do the install, it creates a new instance of Nprinting along the current install, If I delete the previous version (SR1) and keep SR4, when I restore the repository and start the services, It requires me the licencing again, which I dont have (yet) and I thought it should be automatically.
Please if anyone had the same issue or know what could be I'd really appreciate your help.
Thanks
-
Do I have to upgrade QlikView to IR first?
I'm prepping for a QlikView upgrade onto September 2025 SR1, and I want to make sure that I am fully understanding the process. I know that for Qlik S... Show MoreI'm prepping for a QlikView upgrade onto September 2025 SR1, and I want to make sure that I am fully understanding the process. I know that for Qlik Sense, it is required to first upgrade to the IR and then afterwards upgrade (patch) to the desired SR afterwards. Does QlikView work the same way, or can I upgrade directly to an SR and skip the IR?
Thanks!
-
QlikView Distribution Service: This engine has expired! Please upgrade to a newe...
Hello together,after experiencing some reload issues, the services were restarted on QlikView November 2017 SR3.All services except the one mentioned ... Show MoreHello together,
after experiencing some reload issues, the services were restarted on QlikView November 2017 SR3.
All services except the one mentioned above no longer start. According to the service, the error message “1067: Process terminated unexpectedly” appears.
Unfortunately, the instructions at https://community.qlik.com/t5/Official-Support-Articles/QlikView-Distribution-Service-error-on-start-up-1067-Process/ta-p/1712527 did not help me.
The service user has full permissions on the folder.
The QlikView Events log contains the following:
Server Started Timestamp SeverityID EventID Severity Message
20260612T112119.000+0200 20260612T112120.000+0200 1 300 Error EXPIRED: This engine has expired! Please upgrade to a newer version! Expiry date: 2018/08/30Strangely, the license information states "PRODUCTLEVEL; 10;;2024-02-29" (Maintenance has already been canceled)
Is there still a way to fix this problem? I also read that I can still update to the latest version UNTIL February 29, 2024—is that correct? Does that date refer to the release of major versions or also to SRs?
Thanks and greetings

-
DenDrogram issue for me
Hello Team I am using this following link for creating the DenDiagram, Once i copied and opened the html file i could not able to see any output. I... Show MoreHello Team
I am using this following link for creating the DenDiagram, Once i copied and opened the html file i could not able to see any output. Is this code is incomplete
i copied the code at the same folder is R/d3.v3.min.js
R/flare.json - this is copied from the site
R/Den.html
The html code is as followes. Am i need to do any other stuff rather than these three codes.Looking your kind advice


