Unlock a world of possibilities! Login now and discover the exclusive benefits awaiting you.
- Qlik Community
- :
- Forums
- :
- Analytics
- :
- New to Qlik Analytics
- :
- Average of sales por month
- Subscribe to RSS Feed
- Mark Topic as New
- Mark Topic as Read
- Float this Topic for Current User
- Bookmark
- Subscribe
- Mute
- Printer Friendly Page
- Mark as New
- Bookmark
- Subscribe
- Mute
- Subscribe to RSS Feed
- Permalink
- Report Inappropriate Content
Average of sales por month
Hello friends,
I need your help. I need show average of sales por month. But the average have that considerate the month and 11 month ago. Dimension is month of year 2015
| Year | Month | Sales(Uni) |
| 2014 | 1 | 120 |
| 2014 | 2 | 130 |
| 2014 | 3 | 150 |
| 2014 | 4 | 80 |
| 2014 | 5 | 90 |
| 2014 | 6 | 100 |
| 2014 | 7 | 110 |
| 2014 | 8 | 140 |
| 2014 | 9 | 130 |
| 2014 | 10 | 160 |
| 2014 | 11 | 170 |
| 2014 | 12 | 180 |
| 2015 | 1 | 130 |
| 2015 | 2 | 150 |
| 2015 | 3 | 140 |
| 2015 | 4 | 110 |
| 2015 | 5 | 80 |
| 2015 | 6 | 110 |
| 2015 | 7 | 140 |
| 2015 | 8 | 120 |
| 2015 | 9 | 140 |
| 2015 | 10 | 180 |
| 2015 | 11 | 200 |
| 2015 | 12 | 210 |
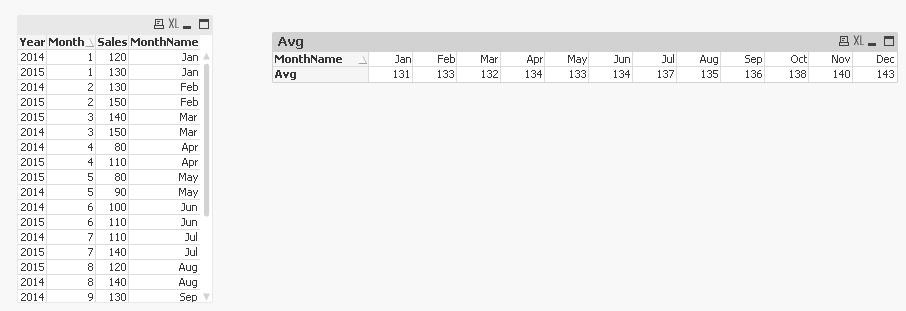
Expected Result:
| Jan | Feb | Mar | April | May | June | July | Agu | Sep | Oct | Nov | Dec |
|---|---|---|---|---|---|---|---|---|---|---|---|
| 131 | 133 | 132 | 134 | 133 | 134 | 137 | 135 | 136 | 138 | 140 | 143 |
thanks for your help
- « Previous Replies
-
- 1
- 2
- Next Replies »
Accepted Solutions
- Mark as New
- Bookmark
- Subscribe
- Mute
- Subscribe to RSS Feed
- Permalink
- Report Inappropriate Content
Thanks so much friend and got what he wanted. This is the final expression. 
Only({<Year = {$(=Max(Year))}>}Aggr(RangeAvg(Above(TOTAL Sum({1} Sales), 0, 12)), Year, MonthName))
- Mark as New
- Bookmark
- Subscribe
- Mute
- Subscribe to RSS Feed
- Permalink
- Report Inappropriate Content
Can you elaborate on the logic to calculate the average once again?
- Mark as New
- Bookmark
- Subscribe
- Mute
- Subscribe to RSS Feed
- Permalink
- Report Inappropriate Content
Of course,
Por example:
January 2015 = SUM(Dec 2014, Nov 2014, Oct 2014, Sep 2014, Agu, July, Jun,May,Apr,Mar,Feb 2014) / 12
February 2015 = SUM(Jan 2015, Dec 2014, Nov 2014, Oct 2014, Sep, Agu, July, Jun,May,Apr,Mar 2014) / 12
March 2015 = SUM(Feb 2015, Jan 2015, Dec 2014, Nov 2014, Oct, Sep, Agu, July, Jun,May,Apr 2014) / 12
thanks for answering
- Mark as New
- Bookmark
- Subscribe
- Mute
- Subscribe to RSS Feed
- Permalink
- Report Inappropriate Content
This?
- Mark as New
- Bookmark
- Subscribe
- Mute
- Subscribe to RSS Feed
- Permalink
- Report Inappropriate Content
Yes, this is ok. But I can not open qvw file in my qlik sense desktop. Which is the set analysis that you used ?
- Mark as New
- Bookmark
- Subscribe
- Mute
- Subscribe to RSS Feed
- Permalink
- Report Inappropriate Content
If your question is now answered, please flag the Correct Answer (via the big "Correct Answer" button near every post) and Helpful Answers (found under the Actions menu under every post).
If not, please make clear what part of this topic you still need help with .
- Mark as New
- Bookmark
- Subscribe
- Mute
- Subscribe to RSS Feed
- Permalink
- Report Inappropriate Content
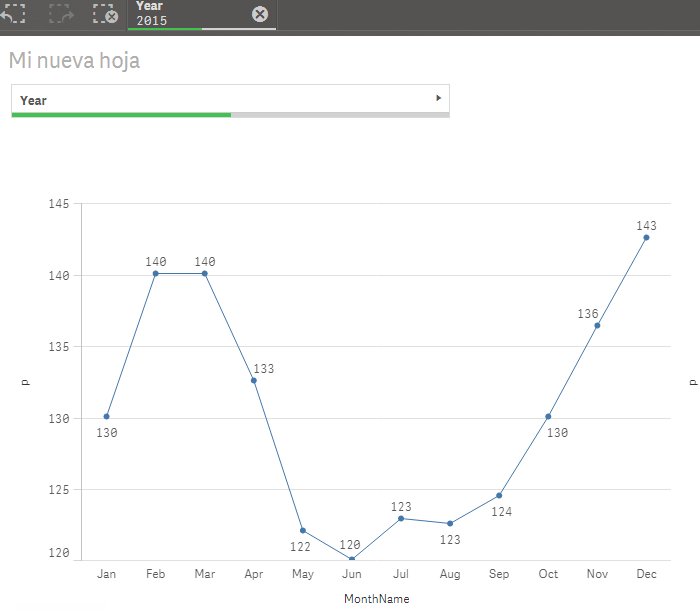
Expression used:
=Only({<Year = {$(=Max(Year))}>}Aggr(RangeAvg(Above(TOTAL Sum(Sales), 0, 12)), Year, MonthName))
- Mark as New
- Bookmark
- Subscribe
- Mute
- Subscribe to RSS Feed
- Permalink
- Report Inappropriate Content
Thanks for your help. But I have a problem. The year I have as a filter and when I select a specific year to evaluate the expression does not work. I can change to make it work ?
- Mark as New
- Bookmark
- Subscribe
- Mute
- Subscribe to RSS Feed
- Permalink
- Report Inappropriate Content
How about this:
=Only({<Year = {$(=Max(Year))}>}Aggr(RangeAvg(Above(TOTAL Sum({<Year = {"$(='>=' & Max(Year) - 1)"}>} Sales), 0, 12)), Year, MonthName))
- Mark as New
- Bookmark
- Subscribe
- Mute
- Subscribe to RSS Feed
- Permalink
- Report Inappropriate Content
The expression not found. If I do not select the year, the grafic is well.

But I select the year the chart is wrong.
Then I add data from 2016, and I want to select the year al get the average sales for the selected year.
- « Previous Replies
-
- 1
- 2
- Next Replies »