Unlock a world of possibilities! Login now and discover the exclusive benefits awaiting you.
- Qlik Community
- :
- All Forums
- :
- QlikView App Dev
- :
- Adding crashimage or any custom image Actual VS Ta...
- Subscribe to RSS Feed
- Mark Topic as New
- Mark Topic as Read
- Float this Topic for Current User
- Bookmark
- Subscribe
- Mute
- Printer Friendly Page
- Mark as New
- Bookmark
- Subscribe
- Mute
- Subscribe to RSS Feed
- Permalink
- Report Inappropriate Content
Adding crashimage or any custom image Actual VS Target
Hi
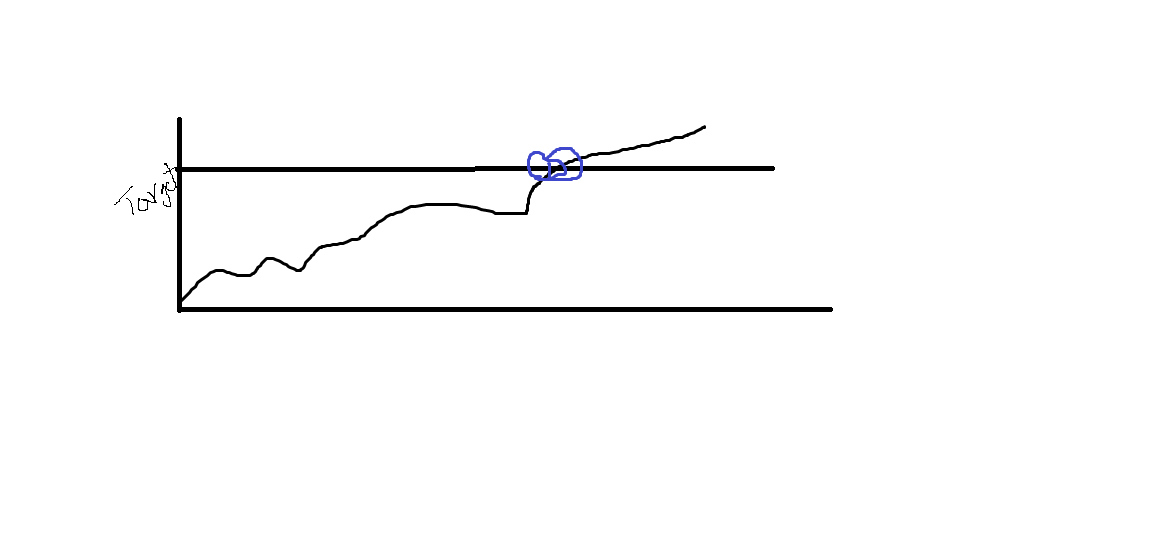
I need to add image in actual vs Target crash date like below.
Please find the attached excel and Qvw for reference.
Here Max is a variable which i can give my target value
I need add image in crash place a bubble or any * image also fine
please do the needful
- Mark as New
- Bookmark
- Subscribe
- Mute
- Subscribe to RSS Feed
- Permalink
- Report Inappropriate Content
Thiru,
Here What are you expecting. Can you please post on Expected Image
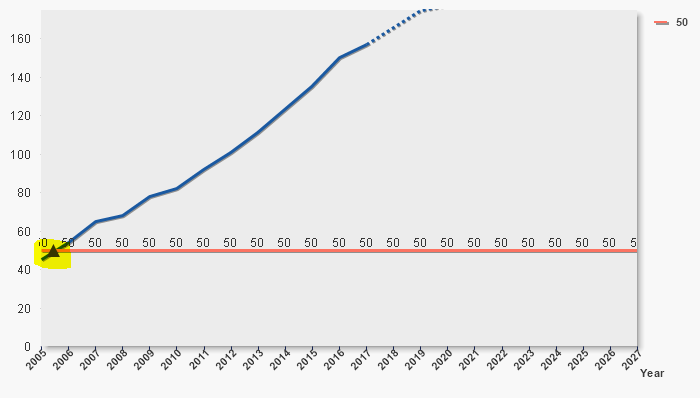
Updated : Are you expecting, Something like below
- ANIL
- Mark as New
- Bookmark
- Subscribe
- Mute
- Subscribe to RSS Feed
- Permalink
- Report Inappropriate Content
Hi
When you say image do you mean a dot or triangle or something like that on a line?
- Mark as New
- Bookmark
- Subscribe
- Mute
- Subscribe to RSS Feed
- Permalink
- Report Inappropriate Content
Hi Brain,
Yes some thing like below or if any bubbol or triangle with bigger size.
Thiru
- Mark as New
- Bookmark
- Subscribe
- Mute
- Subscribe to RSS Feed
- Permalink
- Report Inappropriate Content
Yes Anil this also fine but i want to show somthing big symbol
- Mark as New
- Bookmark
- Subscribe
- Mute
- Subscribe to RSS Feed
- Permalink
- Report Inappropriate Content
Thiru,
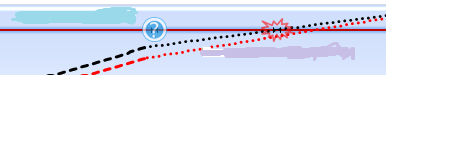
I am not sure something like this
- Mark as New
- Bookmark
- Subscribe
- Mute
- Subscribe to RSS Feed
- Permalink
- Report Inappropriate Content
Hi
If you go to the expression tab in your chart properties and for each expression that you want to show a symbol on the line for go to display options and tick the checkbox next to symbol. Then go to the presentation tab and under Line/Symbol select the symbol size. I hope this helps.
Kindest regards
Brian
- Mark as New
- Bookmark
- Subscribe
- Mute
- Subscribe to RSS Feed
- Permalink
- Report Inappropriate Content
Hi Brain,
Thnaks for your reply.
I am looking for based on some condition need to apply.something like conditional formating
Thiru