Unlock a world of possibilities! Login now and discover the exclusive benefits awaiting you.
- Qlik Community
- :
- Forums
- :
- Analytics
- :
- New to Qlik Analytics
- :
- Re: How to make chart legend label dynamic in Qlik...
- Subscribe to RSS Feed
- Mark Topic as New
- Mark Topic as Read
- Float this Topic for Current User
- Bookmark
- Subscribe
- Mute
- Printer Friendly Page
- Mark as New
- Bookmark
- Subscribe
- Mute
- Subscribe to RSS Feed
- Permalink
- Report Inappropriate Content
How to make chart legend label dynamic in Qlik Sense?
I created a time series chart with Qlik sense.
I would like to set the label legend dynamic. When I select different time, the label will show the year I select.
Any suggestion is appreciated!
My data is as the following:
| myTime | myNumber |
| 2013 | 2 |
| 2013 | 4 |
| 2013 | 6 |
| 2013 | 7 |
| 2013 | 5 |
| 2014 | 3 |
| 2014 | 1 |
| 2014 | 9 |
| 2014 | 7 |
| 2014 | 2 |
| 2015 | 5 |
| 2015 | 8 |
| 2015 | 2 |
| 2015 | 3 |
| 2015 | 4 |
| 2016 | 7 |
| 2016 | 9 |
| 2016 | 6 |
| 2016 | 4 |
| 2016 | 5 |
- Mark as New
- Bookmark
- Subscribe
- Mute
- Subscribe to RSS Feed
- Permalink
- Report Inappropriate Content
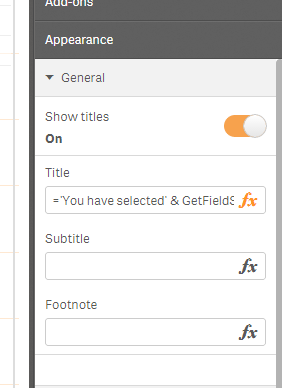
Hi
Go to
General--->Title...>
type this
='You have selected' & GetFieldSelections(myTime)
- Mark as New
- Bookmark
- Subscribe
- Mute
- Subscribe to RSS Feed
- Permalink
- Report Inappropriate Content
Hi
Is my solution working ?
please mark 'Answered' , if it is fine for you .
otherwise some one else from this community will help you ...
Regards
Allu
- Mark as New
- Bookmark
- Subscribe
- Mute
- Subscribe to RSS Feed
- Permalink
- Report Inappropriate Content
Hi Alluraiah , thanks so much for your help!
Your method could set the title dynamic.
I need set the legend label dynamic.
This is still possible walk around method.
I will create a QVF file and make my question more specific.