Unlock a world of possibilities! Login now and discover the exclusive benefits awaiting you.
- Qlik Community
- :
- All Forums
- :
- QlikView App Dev
- :
- Combo Chart with accumulation and % change
- Subscribe to RSS Feed
- Mark Topic as New
- Mark Topic as Read
- Float this Topic for Current User
- Bookmark
- Subscribe
- Mute
- Printer Friendly Page
- Mark as New
- Bookmark
- Subscribe
- Mute
- Subscribe to RSS Feed
- Permalink
- Report Inappropriate Content
Combo Chart with accumulation and % change
I'm having issues getting my combo chart to display correctly. I have attached a sample.
Essentially, I would like a line chart of % change from previous month (formula seems to be accurate in sample attached) .
A rolling 6 month. So take the latest 6 months.
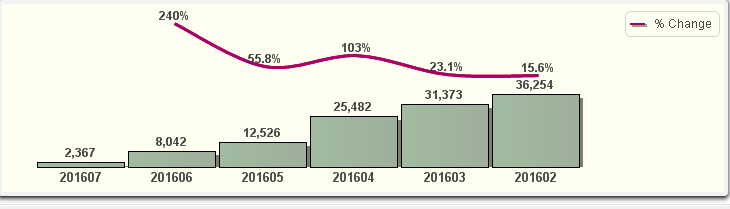
Something like below but my accumulation seems backwards or my values are. I've been messing with the sort order but I cannot get to display corretly.
I would like to see
horizontal axis last 6 values. So starting with 201602 to 201603 to 201607. Also, I would need to reverse my line chart % change to read from lef to right and my accumulation to read correctly. It's wrong now. Values should be higher the later the month.
- « Previous Replies
-
- 1
- 2
- Next Replies »
Accepted Solutions
- Mark as New
- Bookmark
- Subscribe
- Mute
- Subscribe to RSS Feed
- Permalink
- Report Inappropriate Content
- Mark as New
- Bookmark
- Subscribe
- Mute
- Subscribe to RSS Feed
- Permalink
- Report Inappropriate Content
folow
- Mark as New
- Bookmark
- Subscribe
- Mute
- Subscribe to RSS Feed
- Permalink
- Report Inappropriate Content
Any ideas?
- Mark as New
- Bookmark
- Subscribe
- Mute
- Subscribe to RSS Feed
- Permalink
- Report Inappropriate Content
I'll check it out tomorrow, thanks,
- Mark as New
- Bookmark
- Subscribe
- Mute
- Subscribe to RSS Feed
- Permalink
- Report Inappropriate Content
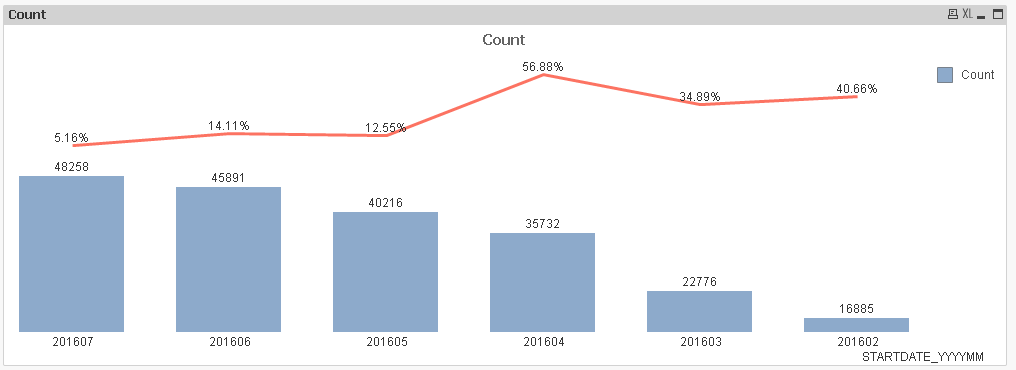
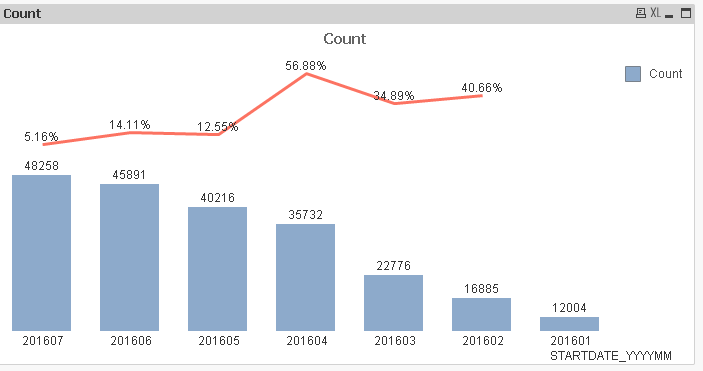
Is this what you want?
Expressions used:
1) =RangeSum(Below(Count({<STARTDATE_YYYYMM = {"*2016*"}>} ID), 0, NoOfRows() - RowNo() + 1)) - > Without full accumulation
2) Num(
RangeSum(Below(Count({<STARTDATE_YYYYMM = {"*2016*"}>} ID), 0, NoOfRows() - RowNo() + 1))/
RangeSum(Below(Count({<STARTDATE_YYYYMM = {"*2016*"}>} ID), 1, NoOfRows() - RowNo() + 1)) - 1,
'#.00%')
- Mark as New
- Bookmark
- Subscribe
- Mute
- Subscribe to RSS Feed
- Permalink
- Report Inappropriate Content
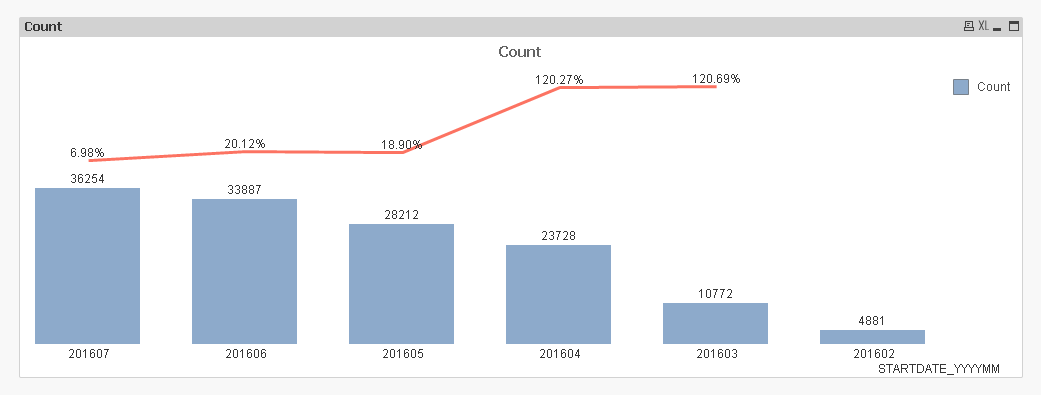
Close. How would I update to Count all.
In the above example it takes the Count from what's displayed in the chart. I would like to count all but only display 6 values.
- Mark as New
- Bookmark
- Subscribe
- Mute
- Subscribe to RSS Feed
- Permalink
- Report Inappropriate Content
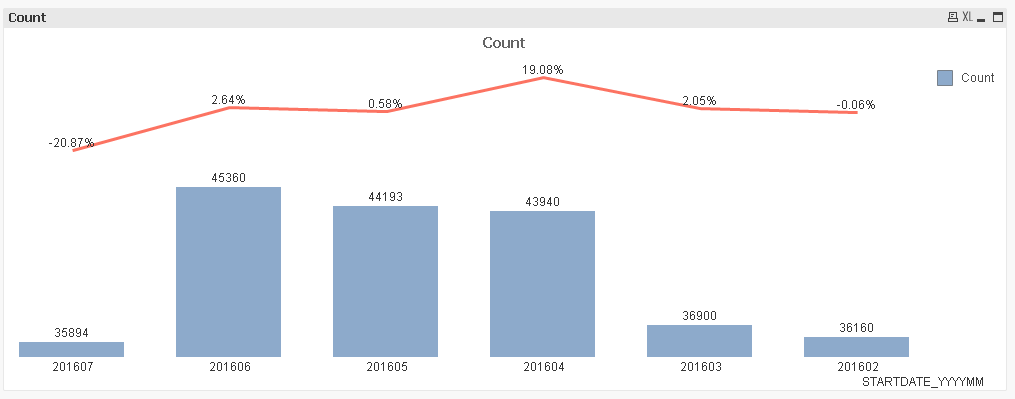
This?
- Mark as New
- Bookmark
- Subscribe
- Mute
- Subscribe to RSS Feed
- Permalink
- Report Inappropriate Content
No, I would like to see what's atttached but only display 6 months. When the dimension limit is selected the totals change. Can there be an expression that counts all and not based on what's being displayed? I hope that makes sense.
- Mark as New
- Bookmark
- Subscribe
- Mute
- Subscribe to RSS Feed
- Permalink
- Report Inappropriate Content
I am not sure what you are trying to do. Do you just want 6 month accumulation or all time accumulation? The image I posted above only shows 6 months without using the dimension limits. How is it not meeting your requirement?
- Mark as New
- Bookmark
- Subscribe
- Mute
- Subscribe to RSS Feed
- Permalink
- Report Inappropriate Content
all time accumulation but only want to display 6 months.
- « Previous Replies
-
- 1
- 2
- Next Replies »