Unlock a world of possibilities! Login now and discover the exclusive benefits awaiting you.
- Qlik Community
- :
- Forums
- :
- Analytics
- :
- New to Qlik Analytics
- :
- Color by as a % of total
- Subscribe to RSS Feed
- Mark Topic as New
- Mark Topic as Read
- Float this Topic for Current User
- Bookmark
- Subscribe
- Mute
- Printer Friendly Page
- Mark as New
- Bookmark
- Subscribe
- Mute
- Subscribe to RSS Feed
- Permalink
- Report Inappropriate Content
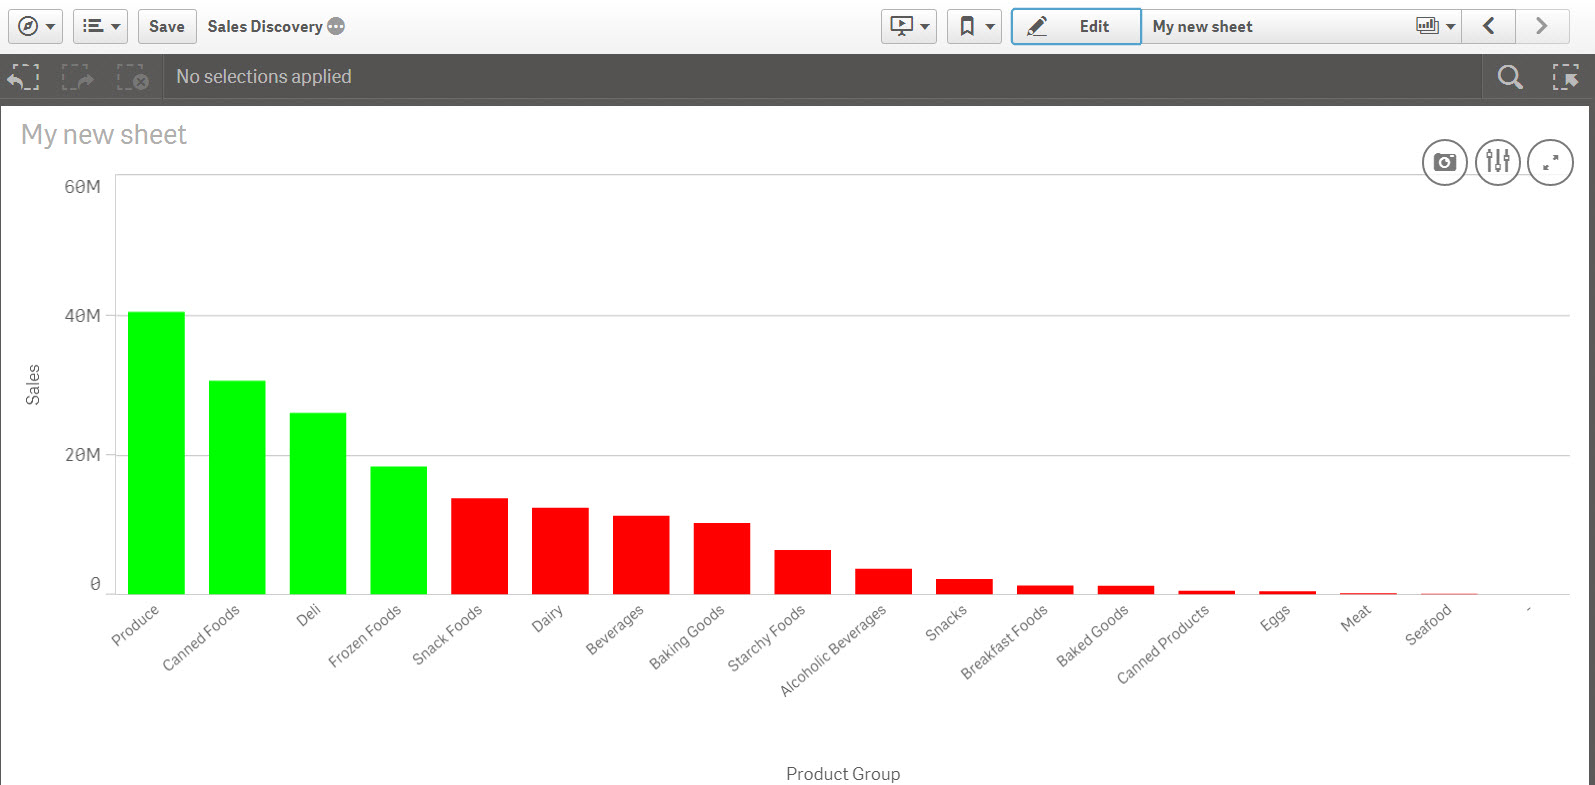
Color by as a % of total
Hi,
New to Qlik Sense but have used other visualization products and have a simple request. I need to create a color by expression that will color my chart if the segments are more than 10% of the total. My example is I have product sales and if any products individual sales are over 10% of the total sales than color them a different color than all the rest. How do I evaluate each individually as part of the total?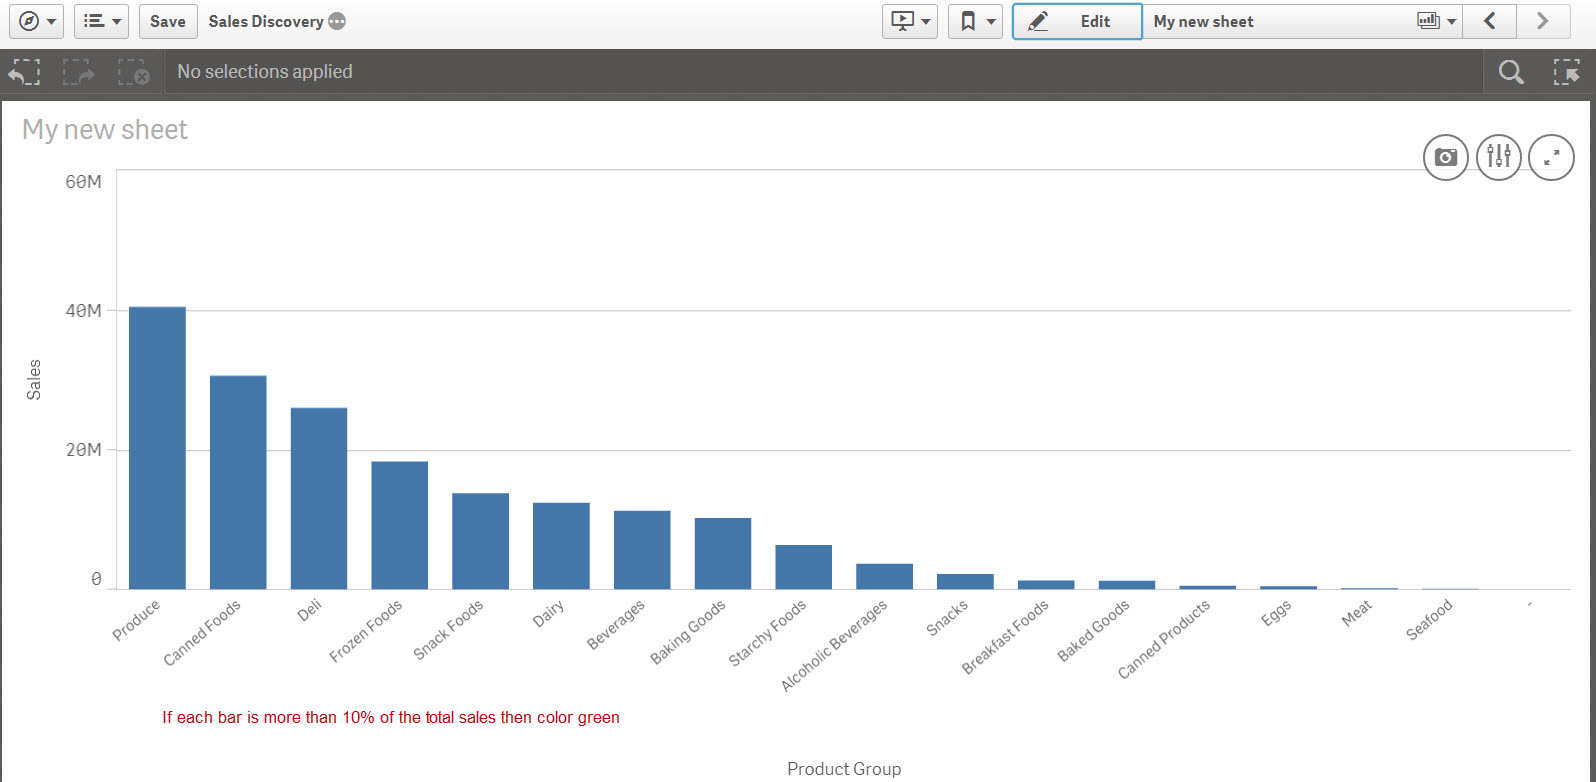
- Tags:
- color by expression
- Mark as New
- Bookmark
- Subscribe
- Mute
- Subscribe to RSS Feed
- Permalink
- Report Inappropriate Content
Edit the visual, go to Properties, Appearance, Colors and Legends.
Change the color from 'Auto' to Custom, and select By Expression.
for your example, use:
If (sum([Sales]) > sum(total [Sale]) * .1,
lightgreen(), //or an RGB color. this is the True condition
lightred() //or the color of your choice. this is the false condition
)
If you always want to color based on the total sales regardless of what is selected, then change the expression to:
If (sum([Sales]) > sum( {1} total [Sale]) * .1,
lightgreen(), //or an RGB color
lightred()
)
- Mark as New
- Bookmark
- Subscribe
- Mute
- Subscribe to RSS Feed
- Permalink
- Report Inappropriate Content
Thanks Paul. Worked great!