Unlock a world of possibilities! Login now and discover the exclusive benefits awaiting you.
- Qlik Community
- :
- Forums
- :
- Analytics
- :
- App Development
- :
- Re: FirstSortedValue and Set Analysis
- Subscribe to RSS Feed
- Mark Topic as New
- Mark Topic as Read
- Float this Topic for Current User
- Bookmark
- Subscribe
- Mute
- Printer Friendly Page
- Mark as New
- Bookmark
- Subscribe
- Mute
- Subscribe to RSS Feed
- Permalink
- Report Inappropriate Content
FirstSortedValue and Set Analysis
Folks,
I am struggling with syntax (I think!).
I am trying to look up the age for a particular Qx. The data is stored like this.
| Member Age | QxROWMale |
|---|---|
40 | 0.545 |
| 41 | 0.609 |
| 42 | 0.685 |
| 43 | 0.772 |
I am calculating the weighted Qx in a calculation and then want to look up the age. I have the two parts working separately.
I calculate the weighted Qx like this:
(sum({<TrackedQuote={'Yes'},QuoteType-={'Research'},Benefit={'GL'},QuoteStatus={'Issued','Finalised'},
DateQuoteIssued={">=$(=date(vStartDate,'DD/MM/YYYY'))<=$(=date(vEndDate,'DD/MM/YYYY'))"}>}QxROWMale*SumAssuredUSD)/
sum({<TrackedQuote={'Yes'},QuoteType-={'Research'},Benefit={'GL'},QuoteStatus={'Issued','Finalised'},
DateQuoteIssued={">=$(=date(vStartDate,'DD/MM/YYYY'))<=$(=date(vEndDate,'DD/MM/YYYY'))"}>}SumAssuredUSD))
(This calculated the SumAssured * the mortality rate and then divides by the Sum Assured for the given quotes)
I can do the look up if I used a fixed value to look up the age.
firstsortedvalue(MemberAge,aggr(sum({<QxROWMale={'>1.05'}>}QxROWMale),QxROWMale,Region))
Both of these work fine - but I am struggling to combine the two things together. So I need to replace the 1.05 with the answer to the weighted Qx. How would I do that? I have tried this, but it doesn't seem to work?
firstsortedvalue(MemberAge,aggr(sum({<QxROWMale={'>$(=(sum({<TrackedQuote={'Yes'},QuoteType-={'Research'},Benefit={'GL'},QuoteStatus={'Issued','Finalised'},
DateQuoteIssued={">=$(=date(vStartDate,'DD/MM/YYYY'))<=$(=date(vEndDate,'DD/MM/YYYY'))"}>}QxROWMale*SumAssuredUSD)/
sum({<TrackedQuote={'Yes'},QuoteType-={'Research'},Benefit={'GL'},QuoteStatus={'Issued','Finalised'},
DateQuoteIssued={">=$(=date(vStartDate,'DD/MM/YYYY'))<=$(=date(vEndDate,'DD/MM/YYYY'))"}>}SumAssuredUSD)))'}>}QxROWMale),QxROWMale,Region))
Anyone able to help?
Chris
- « Previous Replies
-
- 1
- 2
- Next Replies »
- Mark as New
- Bookmark
- Subscribe
- Mute
- Subscribe to RSS Feed
- Permalink
- Report Inappropriate Content
Try using variable for this.
Store weighted Qx Expression into a variable and then use that variable at the place of 1.05
firstsortedvalue(MemberAge,aggr(sum({<QxROWMale={">$(=vVariable)"}>}QxROWMale),QxROWMale,Region))
- Mark as New
- Bookmark
- Subscribe
- Mute
- Subscribe to RSS Feed
- Permalink
- Report Inappropriate Content
Shraddha,
Many thanks for your reply.
I need this to be at a region level so I can show the data as follows:
Region Average Age Weighted Age Qx Weighted Age
Asia 38.1 39.8 40.6
Middle East 36.2 37.7 39.1
Europe 40.9 42.3 44.1
I have the first 2 columns, and it is the last one I am working on. Unfortunately, the way the calculation works is not a simple aggregation of the data - you need to work out the Sum Assured * Mortality and then divide by the Sum Assured to get the average mortality rate, then look up that rate in a table to get the age. As I said above I can do each bit in turn, but when I bring them together I get in to trouble!
Can a variable be used if it is split by a dimension, or is it a single value?
Many thanks
Chris
- Mark as New
- Bookmark
- Subscribe
- Mute
- Subscribe to RSS Feed
- Permalink
- Report Inappropriate Content
variable will b a value calculated according to the region value in 1st column and that value will be used in first sorted expression.
- Mark as New
- Bookmark
- Subscribe
- Mute
- Subscribe to RSS Feed
- Permalink
- Report Inappropriate Content
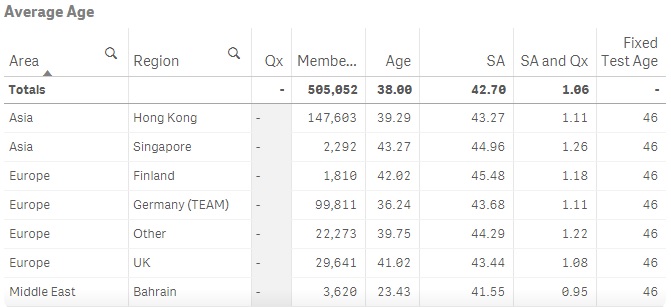
Thanks for your help so far...getting closer.
The variable is defined and used in the table below to show the 'SA and Qx' column,
but when added to the Qx column is returning nulls.
The formula is now:
firstsortedvalue(MemberAge,aggr(sum({<QxROWMale={'>$(=vWeightedQx)'}>}QxROWMale),QxROWMale,Region))
I have tried with both single and double quotes but neither work.
Any ideas?
Cheers
Chris
- Mark as New
- Bookmark
- Subscribe
- Mute
- Subscribe to RSS Feed
- Permalink
- Report Inappropriate Content
Have you checked whether variable is returning correct value?
- Mark as New
- Bookmark
- Subscribe
- Mute
- Subscribe to RSS Feed
- Permalink
- Report Inappropriate Content
Would you be able to share a sample with the expected output you are looking to get?
- Mark as New
- Bookmark
- Subscribe
- Mute
- Subscribe to RSS Feed
- Permalink
- Report Inappropriate Content
Thanks for your response. Yes the variable is working fine - I have used it to populate the column "SA and Qx" above, and I have spot checked some of the values and they seem to be correct.
But when I spot the variable in the formula the column "Qx" seems to be returning nulls as above?
Cheers
Chris
- Mark as New
- Bookmark
- Subscribe
- Mute
- Subscribe to RSS Feed
- Permalink
- Report Inappropriate Content
Sunny,
Thanks for your response.
What I am trying to do is use the variable that results in column "SA and Qx" in the table above, and look up the highest age over that amount from a table that is effectively :
MemberAge QxROWMale
45 0.968
46 1.069
47 1.181
48 1.271
So for Hong Kong, where I have a variable answer of 1.11 I need to return the MemberAge 47. In the case of Singapore in the table above, I need to return 48.
All suggestions welcome!
Cheers
Chris
- Mark as New
- Bookmark
- Subscribe
- Mute
- Subscribe to RSS Feed
- Permalink
- Report Inappropriate Content
Since you are doing a row by row comparison, I feel like you would need to use Aggr() function instead of using set analysis because set analysis is evaluated once per chart. It won't be able to pick 1.11 for Hong Kong and 1.26 for Singapore.
May be like this:
Min(Aggr(If(QxROWMale >= vVariable, MemberAge), Area, Region, MemberAge))
- « Previous Replies
-
- 1
- 2
- Next Replies »