Unlock a world of possibilities! Login now and discover the exclusive benefits awaiting you.
- Qlik Community
- :
- Forums
- :
- Analytics
- :
- New to Qlik Analytics
- :
- Re: Qlik Sense - Problem sorting legend
- Subscribe to RSS Feed
- Mark Topic as New
- Mark Topic as Read
- Float this Topic for Current User
- Bookmark
- Subscribe
- Mute
- Printer Friendly Page
- Mark as New
- Bookmark
- Subscribe
- Mute
- Subscribe to RSS Feed
- Permalink
- Report Inappropriate Content
Qlik Sense - Problem sorting legend
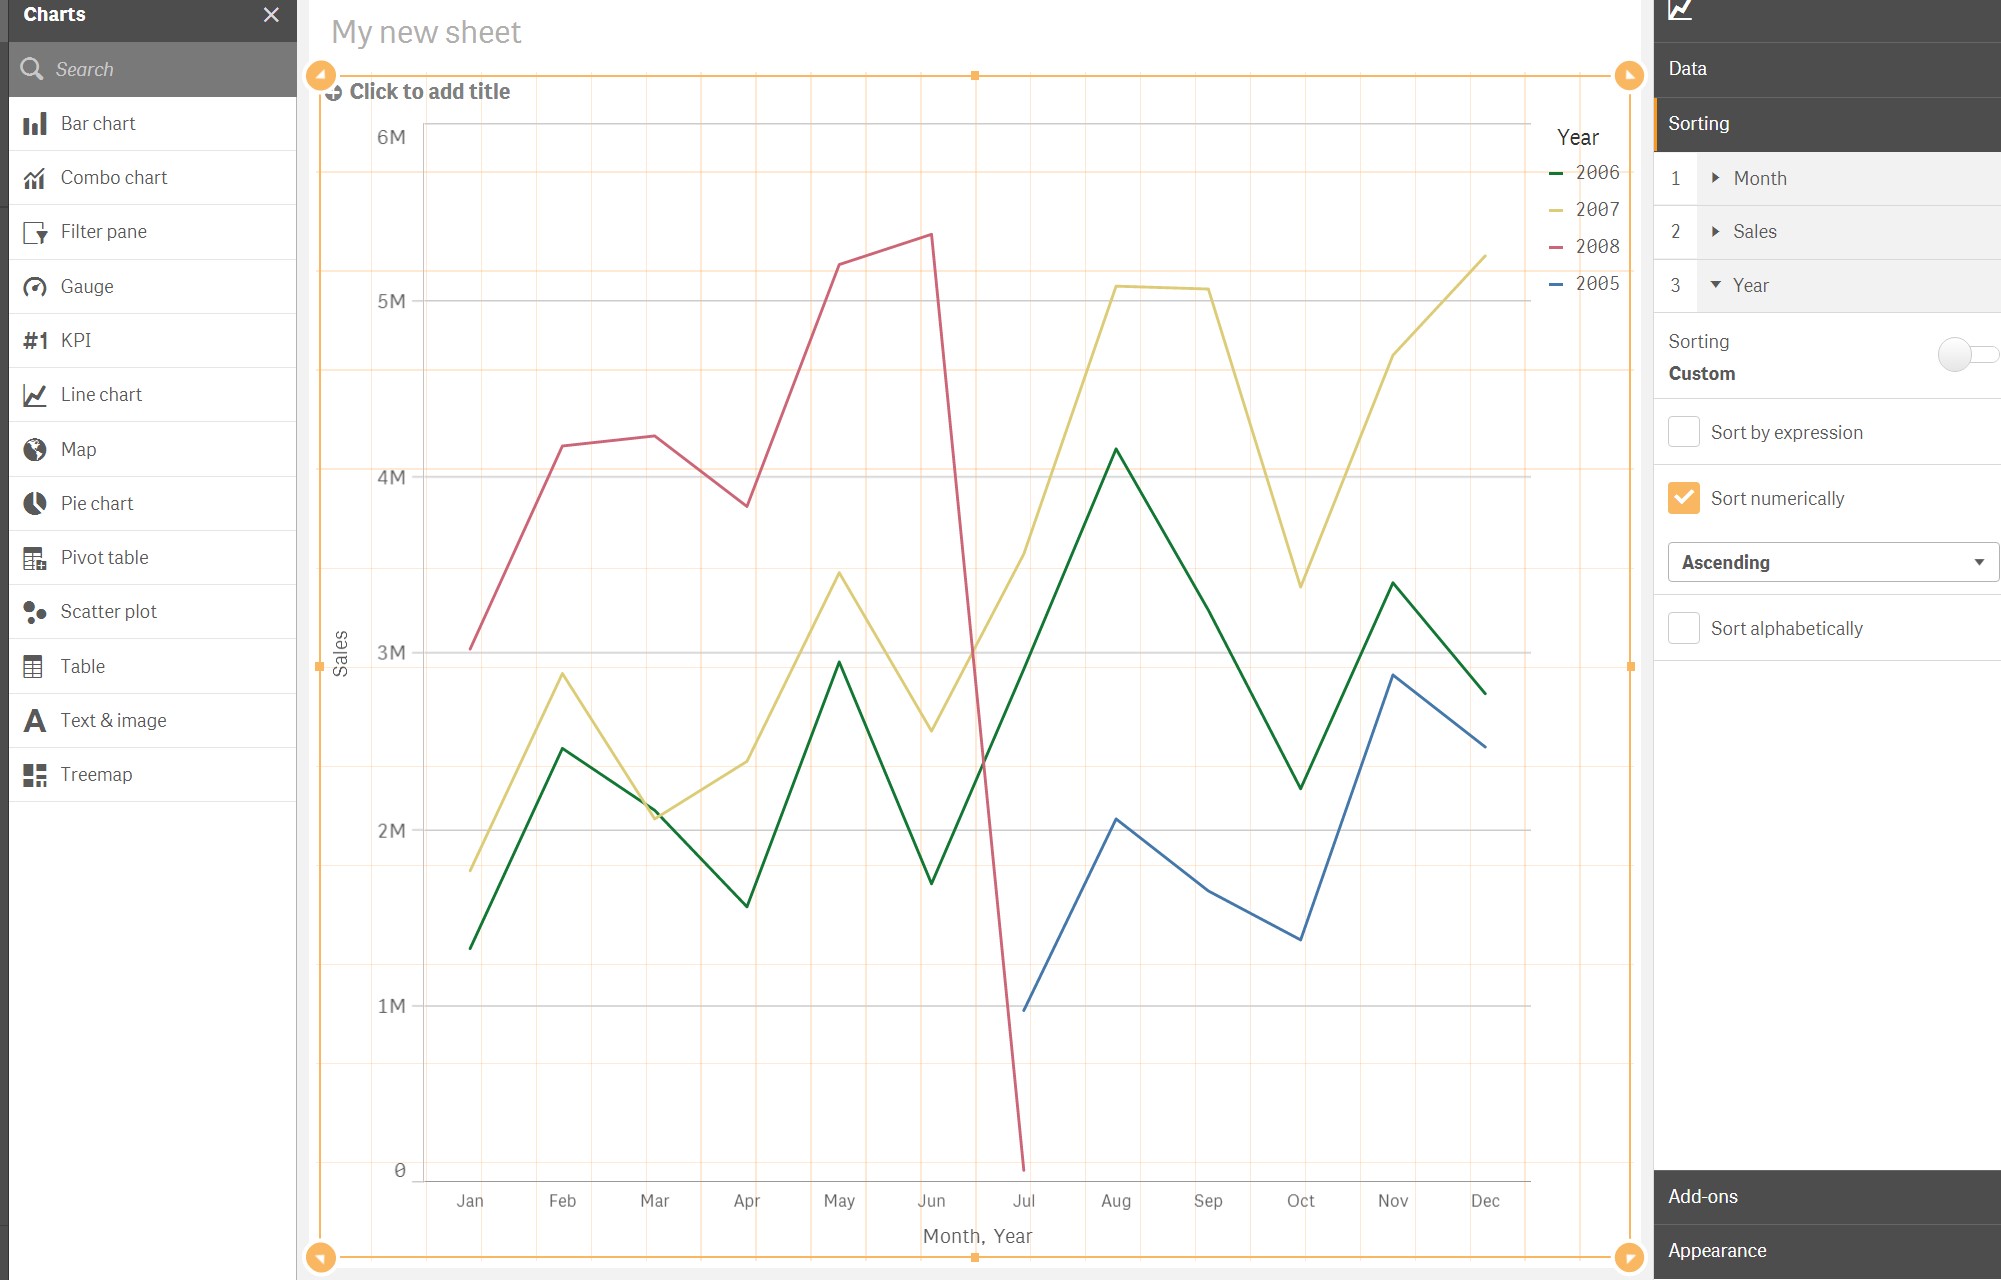
I have a line chart with two dimensions, Month & Year. However, on the first year the data only starts in July so the legend is not sorted correctly. On our actual data the problem is even worse as many of the years have only got data for a few months (and not necessarily starting in January). I understand the why, but was wondering if there was an obvious fix I was missing. Below is a simplified example of the problem. I'd like the legend to be sorted correctly.
- « Previous Replies
-
- 1
- 2
- Next Replies »
- Mark as New
- Bookmark
- Subscribe
- Mute
- Subscribe to RSS Feed
- Permalink
- Report Inappropriate Content
You need to move the Year up above Month..
- Mark as New
- Bookmark
- Subscribe
- Mute
- Subscribe to RSS Feed
- Permalink
- Report Inappropriate Content
You can't do that Ralf. Once you set the Month as the first dimension and Year as the second dimension, you can't move Year on top of Month when sorting.
Guy is asking a reasonable thing but this thing doesn't look doable in Sense for now.
It makes some sense: if you want to sort month from Jan to Dec, then sort for Year will start from the first year that has Jan.
Hope someone can figure out some way to do it.
Fei.
- Mark as New
- Bookmark
- Subscribe
- Mute
- Subscribe to RSS Feed
- Permalink
- Report Inappropriate Content
Try keeping month at 2nd position sort numerically.
- Mark as New
- Bookmark
- Subscribe
- Mute
- Subscribe to RSS Feed
- Permalink
- Report Inappropriate Content
You're right. I tried now myself and only way I could "solve" in v.3.1.1 was to uncheck continuous X-Axis and then sort Year numeric descending (ascending won't work!).

- Mark as New
- Bookmark
- Subscribe
- Mute
- Subscribe to RSS Feed
- Permalink
- Report Inappropriate Content
Thanks for the feedback Ralf, I might have understated the problem.  Some of my years don't have data for the last few months either. So even reversing it doesn't work. Hopefully we'll see a feature add or some other way to do this soon. I don't think it's that unusual a requirement.
- Mark as New
- Bookmark
- Subscribe
- Mute
- Subscribe to RSS Feed
- Permalink
- Report Inappropriate Content
I tried another version where I used a field YearMonth instead of Month, then using this expression for it:
1. Dim: Num(YearMonth) // 1..12
2. Dim: Year
Now ascending order of Year works, but descending not..
- Mark as New
- Bookmark
- Subscribe
- Mute
- Subscribe to RSS Feed
- Permalink
- Report Inappropriate Content
However, I wonder why we cannot sort in the order 1. Dim, 2. Dim, Measure.
I think this was possible in a previous version?
- Mark as New
- Bookmark
- Subscribe
- Mute
- Subscribe to RSS Feed
- Permalink
- Report Inappropriate Content
Hehe, now I did the old QlikView trick:
1. Convert the chart to a barchart
2. Move the dimension Year up to 2nd position in the sortorder, as suggested in my first reply 🙂
3. Convert the chart back to a linechart

- Mark as New
- Bookmark
- Subscribe
- Mute
- Subscribe to RSS Feed
- Permalink
- Report Inappropriate Content
Thanks again for the efforts Ralf. You got my hopes up there. If I correct the month sort order though it seems to lose it again (Unless I misunderstood your method). I note yours is running from December. I think that Sense is iterating through the first dimensions values to retrieve the associated values in the second to display on the legend and so it appears in the order that they're discovered. It makes sense why they'd do it that way given that they want it to be lightweight, responsive and data driven rather than having collections which need to be updated for every selection.
- « Previous Replies
-
- 1
- 2
- Next Replies »