Unlock a world of possibilities! Login now and discover the exclusive benefits awaiting you.
- Qlik Community
- :
- Forums
- :
- Analytics
- :
- New to Qlik Analytics
- :
- Re: Cumulative Sum
- Subscribe to RSS Feed
- Mark Topic as New
- Mark Topic as Read
- Float this Topic for Current User
- Bookmark
- Subscribe
- Mute
- Printer Friendly Page
- Mark as New
- Bookmark
- Subscribe
- Mute
- Subscribe to RSS Feed
- Permalink
- Report Inappropriate Content
Cumulative Sum
This is my graph:
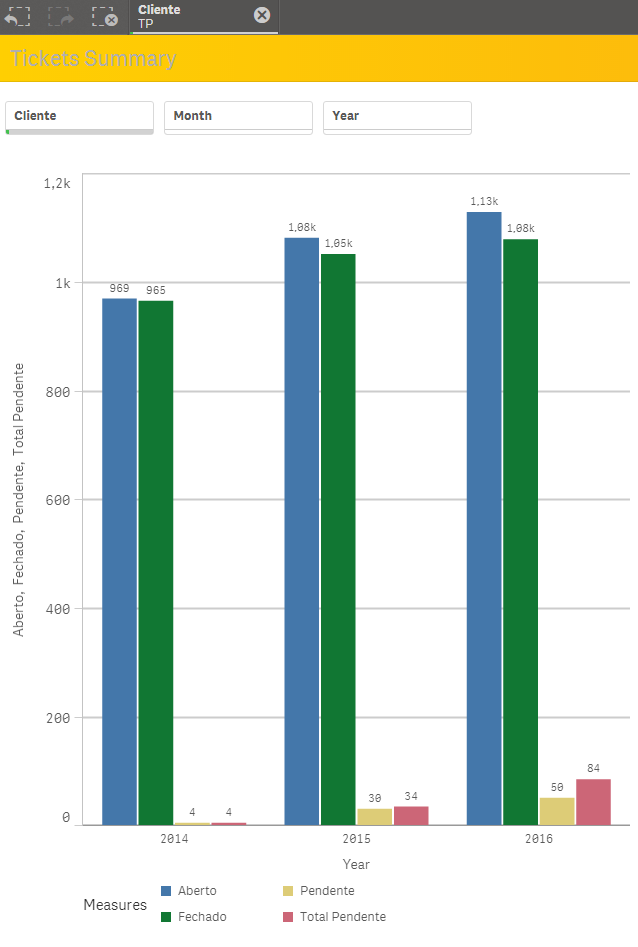
At the moment I am having trouble with the measure "Total Pendente". It´s suppose to sum the number of tickets in state vPendentes of previous months and years.
If in 2014 we close the year with 4 tickets "Pendente" on Jan 2015 it should be: 4 of 2014 plus 1 of Jan 2015.
Another ex: if i select Mar 2016 it should sum all month before Mar 2016 and Mar 2016 included;
It is still important that the graph correspond to selections like client (its on the same table).
Here is the code for Total Pendente at the moment:
RangeSum(
Above(
Count(
{$<status_name = {$(vPendente)},
Month,
Year>}
[ticket_id]),
0,
RowNo())
) * Avg(1)
- Tags:
- cumulative sum
- « Previous Replies
-
- 1
- 2
- Next Replies »
Accepted Solutions
- Mark as New
- Bookmark
- Subscribe
- Mute
- Subscribe to RSS Feed
- Permalink
- Report Inappropriate Content
May be this:
RangeSum(Above(Count({$<status_id = {1,4,6,7,8,10,12,13,15}, Month, Year, MonthYear = {"$(='<=' & Date(Max(MonthYear), 'MMM-YYYY'))"}>} [ticket_id]), 0, RowNo())) * Avg(1)
- Mark as New
- Bookmark
- Subscribe
- Mute
- Subscribe to RSS Feed
- Permalink
- Report Inappropriate Content
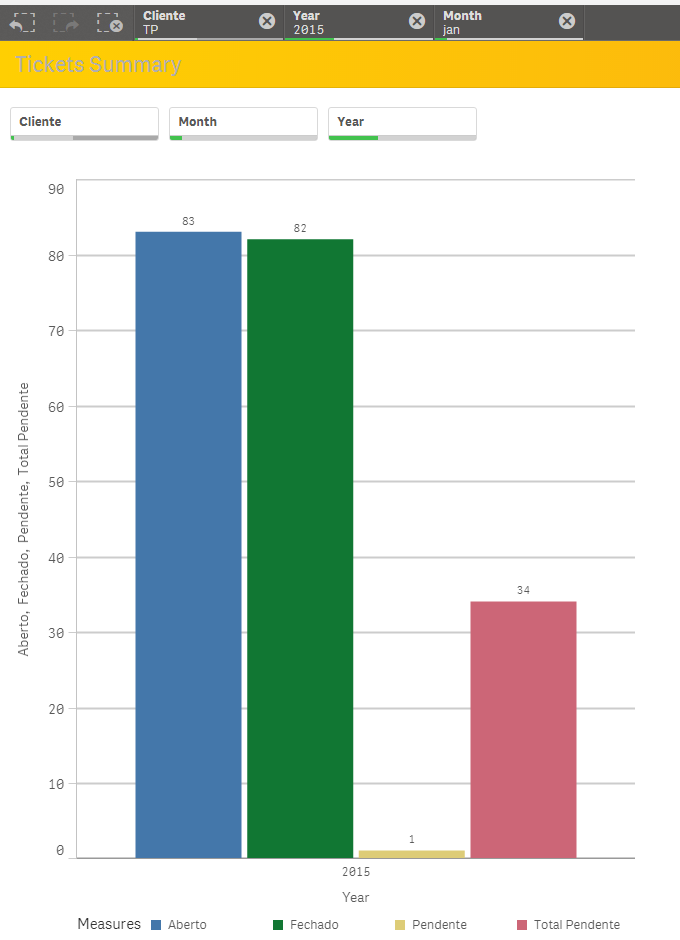
Is this not working? I mean you are seeing 34 for 2015? Isn't that right?
- Mark as New
- Bookmark
- Subscribe
- Mute
- Subscribe to RSS Feed
- Permalink
- Report Inappropriate Content
It should be 35
- Mark as New
- Bookmark
- Subscribe
- Mute
- Subscribe to RSS Feed
- Permalink
- Report Inappropriate Content
Sorry, it should be 5. 4 from the previous dates and 1 from the current month selected
- Mark as New
- Bookmark
- Subscribe
- Mute
- Subscribe to RSS Feed
- Permalink
- Report Inappropriate Content
May be try this:
RangeSum(
RangeSum(Above(Count({$<status_name = {$(vPendente)}, Month, Year>} [ticket_id]), 1, RowNo())), Count({$<status_name = {$(vPendente)}>} [ticket_id])) * Avg(1)
- Mark as New
- Bookmark
- Subscribe
- Mute
- Subscribe to RSS Feed
- Permalink
- Report Inappropriate Content
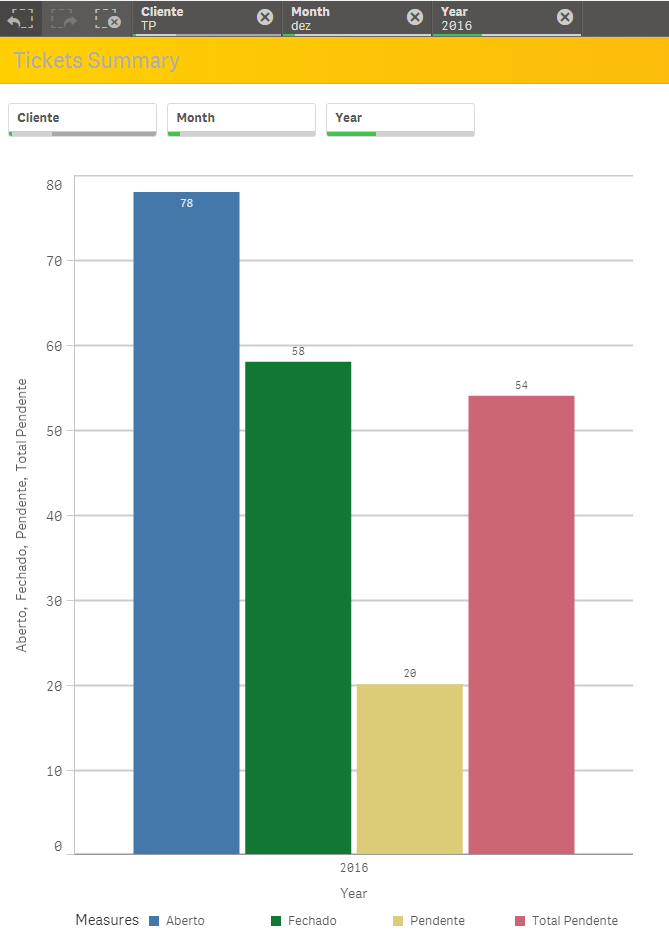
Its still not finished because if i select the last possible date, Dez 2016, the sum should be the 84 as indicated in the first picture. For an x date is suppose to count the tickets before that date and also the x date
- Mark as New
- Bookmark
- Subscribe
- Mute
- Subscribe to RSS Feed
- Permalink
- Report Inappropriate Content
I see what you mean, but I would have to test this out before I can offer a suggestion here, would you be able to share a sample?
- Mark as New
- Bookmark
- Subscribe
- Mute
- Subscribe to RSS Feed
- Permalink
- Report Inappropriate Content
Can you send me a email just so i can send you another with the excel with the records. I don´t thinks its possible to attach an excel here.
My is salero.rafael@gmail.com
- Mark as New
- Bookmark
- Subscribe
- Mute
- Subscribe to RSS Feed
- Permalink
- Report Inappropriate Content
You can attach here:
- Mark as New
- Bookmark
- Subscribe
- Mute
- Subscribe to RSS Feed
- Permalink
- Report Inappropriate Content
The variable vPendente correspond to
'1',
'4',
'6',
'7',
'8',
'10',
'12',
'13',
'15'
The measure "Pendente" is:
Count(
{$<status_name={$(vPendente)}>
}ticket_id)
- « Previous Replies
-
- 1
- 2
- Next Replies »