Unlock a world of possibilities! Login now and discover the exclusive benefits awaiting you.
- Qlik Community
- :
- Forums
- :
- Analytics
- :
- New to Qlik Analytics
- :
- Re: Select a dimension, time
- Subscribe to RSS Feed
- Mark Topic as New
- Mark Topic as Read
- Float this Topic for Current User
- Bookmark
- Subscribe
- Mute
- Printer Friendly Page
- Mark as New
- Bookmark
- Subscribe
- Mute
- Subscribe to RSS Feed
- Permalink
- Report Inappropriate Content
Select a dimension, time
Hello,
I´m already have a few graphs created that use the dimension time like the years of the data.
This is my model:
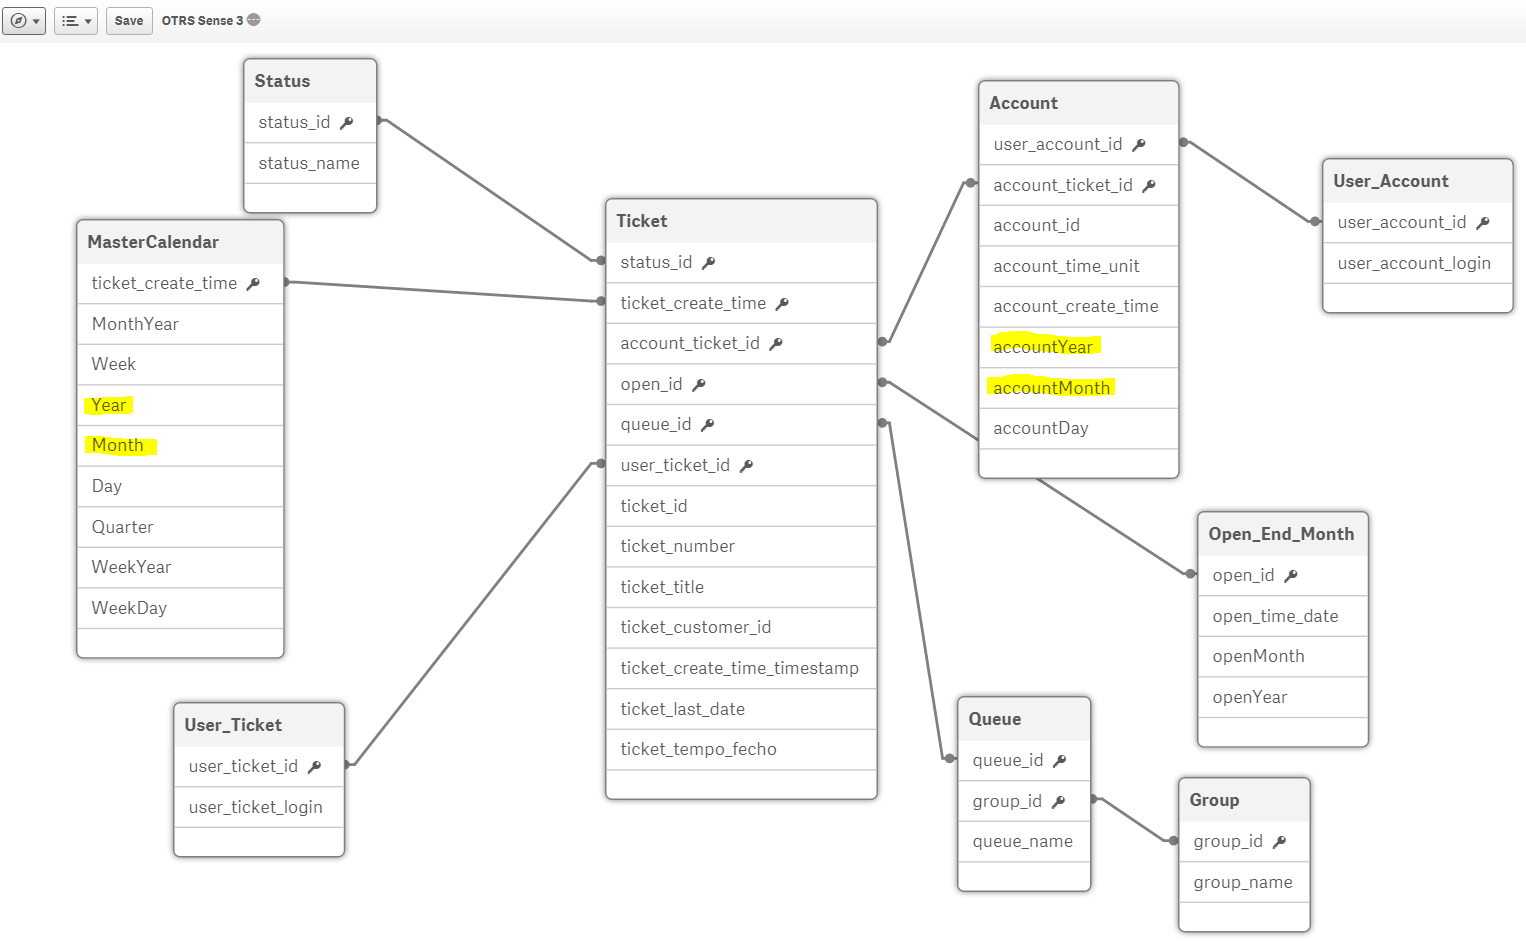
I would like that when I select "Year" only affect the graph that i want and doesn´t alter the others. And the same for the dimension "accountYear".
Better yet, if possible, then i select the "Year" 2016 also select "accountYear" 2016, and then only affect the graph with the corresponded dimensions.
PS: some graph have the dimension "Year" and others the dimension "accountYear".
What should I do?
- « Previous Replies
-
- 1
- 2
- Next Replies »
Accepted Solutions
- Mark as New
- Bookmark
- Subscribe
- Mute
- Subscribe to RSS Feed
- Permalink
- Report Inappropriate Content
Try
Avg({<Year,Ticket_create_time>} Aggr(Sum( {<Year,Ticket_create_time>} account_time_unit), ticket_id,accountMonth, accountYear ))
If a post helps to resolve your issue, please accept it as a Solution.
- Mark as New
- Bookmark
- Subscribe
- Mute
- Subscribe to RSS Feed
- Permalink
- Report Inappropriate Content
Use Alternate States for your filter and chart
- Mark as New
- Bookmark
- Subscribe
- Mute
- Subscribe to RSS Feed
- Permalink
- Report Inappropriate Content
one option is edit your set expressions to ignore selections on those fields as below
For example, a chart using dimension accountyear
Count(account_id) >> CHange to >> Count( {<Year>} account_id) << This will ignore selections made on Year Field
use vice versa for chart with Year as Dimension add {<accountYear>} to the set
If a post helps to resolve your issue, please accept it as a Solution.
- Mark as New
- Bookmark
- Subscribe
- Mute
- Subscribe to RSS Feed
- Permalink
- Report Inappropriate Content
Hi Rafael,
use the alternate states,
or
using Sets:
which dimension you are using the chart, except that and remaining filters u can ignore like below.
sum({<year=,[accountYear]={$}>}sales)
Regards
Sathish
- Mark as New
- Bookmark
- Subscribe
- Mute
- Subscribe to RSS Feed
- Permalink
- Report Inappropriate Content
Its not correct it still change.
This is my measure:
Avg(Aggr(Sum( {<Year>} account_time_unit), ticket_id,accountMonth, accountYear ))
Didn´t to anything
- Mark as New
- Bookmark
- Subscribe
- Mute
- Subscribe to RSS Feed
- Permalink
- Report Inappropriate Content
Try
Avg({<Year,Ticket_create_time>} Aggr(Sum( {<Year,Ticket_create_time>} account_time_unit), ticket_id,accountMonth, accountYear ))
If a post helps to resolve your issue, please accept it as a Solution.
- Mark as New
- Bookmark
- Subscribe
- Mute
- Subscribe to RSS Feed
- Permalink
- Report Inappropriate Content
Probably i didn´t understand right.
I did this: Avg(Aggr(Sum( {<Year=,accountYear={$}>} account_time_unit), ticket_id,accountMonth, accountYear ))
on a graph where the dimension was accountMonth, it didn´t display the graph
- Mark as New
- Bookmark
- Subscribe
- Mute
- Subscribe to RSS Feed
- Permalink
- Report Inappropriate Content
Thankyou, it worked.
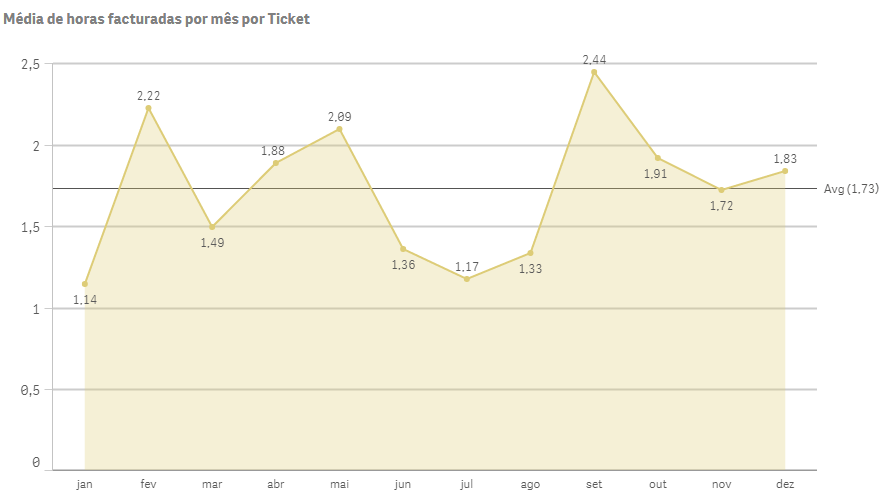
This is the graph, also do you know a way that the selection doesn´t change when i select an accountMonth. So that it doesn´t appear only a dot. I prefer like this, all accountMonth
- Mark as New
- Bookmark
- Subscribe
- Mute
- Subscribe to RSS Feed
- Permalink
- Report Inappropriate Content
No need, already figured out:
Avg({<Year,ticket_create_time, accountMonth = {$(AllMonths)}>} Aggr(Sum( {<Year,ticket_create_time, accountMonth = {$(AllMonths)}>} account_time_unit), ticket_id,accountMonth, accountYear ))
Where AllMonths is 'Jan', 'Fev, ....
Thanks anyway
- Mark as New
- Bookmark
- Subscribe
- Mute
- Subscribe to RSS Feed
- Permalink
- Report Inappropriate Content
Hello vinieme12
Thankyou for your help.
Now i am trying to replicate your answer to other graphs but i´m not being succesfull, could you explain me the logic behind it?
New i´m trying to the Qlik doesn´t do nothing when i select "accountYear" and "accountMonth" to this measure:
RangeSum(
Above(
Count(
{$<status_name = {$(vPendente)},
Month,
Year,
MonthYear = {"$(='<=' & Date(Max(MonthYear), 'MMM-YYYY'))"}>} ticket_id), 0, RowNo())) * Avg(1)
PS: the dimension is "Year"
- « Previous Replies
-
- 1
- 2
- Next Replies »