Unlock a world of possibilities! Login now and discover the exclusive benefits awaiting you.
- Qlik Community
- :
- Forums
- :
- Analytics
- :
- New to Qlik Analytics
- :
- Re: Bar Chart dynamic expression qlik sense
- Subscribe to RSS Feed
- Mark Topic as New
- Mark Topic as Read
- Float this Topic for Current User
- Bookmark
- Subscribe
- Mute
- Printer Friendly Page
- Mark as New
- Bookmark
- Subscribe
- Mute
- Subscribe to RSS Feed
- Permalink
- Report Inappropriate Content
Bar Chart dynamic expression qlik sense
Hi Guys,
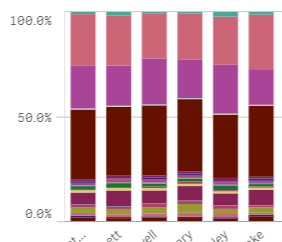
I have a following bar chart, that represents percentage of product sold by Sales Reps. So the below chart would tell me that brown products are old more then the pink product.
Problem: When I click on a single product then every bar becomes 100% like it shows below
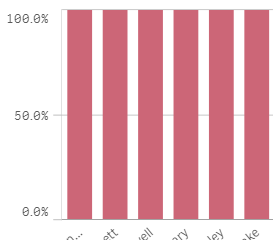
Instead of all 100% I would like to see comparison between reps. Is it possible?
Accepted Solutions
- Mark as New
- Bookmark
- Subscribe
- Mute
- Subscribe to RSS Feed
- Permalink
- Report Inappropriate Content
Assuming you current expression is like this
Sum(Sales)/Sum(TOTAL <[Sales Rep]> Sales)
Add this in there
Sum(Sales)/Sum(TOTAL <[Sales Rep]> {<Product>} Sales)
- Mark as New
- Bookmark
- Subscribe
- Mute
- Subscribe to RSS Feed
- Permalink
- Report Inappropriate Content
Assuming you current expression is like this
Sum(Sales)/Sum(TOTAL <[Sales Rep]> Sales)
Add this in there
Sum(Sales)/Sum(TOTAL <[Sales Rep]> {<Product>} Sales)
- Mark as New
- Bookmark
- Subscribe
- Mute
- Subscribe to RSS Feed
- Permalink
- Report Inappropriate Content
Thank you Shani Dev 