Unlock a world of possibilities! Login now and discover the exclusive benefits awaiting you.
- Qlik Community
- :
- Forums
- :
- Analytics
- :
- New to Qlik Analytics
- :
- Re: CYMTD vs PYMTD in one single measure
- Subscribe to RSS Feed
- Mark Topic as New
- Mark Topic as Read
- Float this Topic for Current User
- Bookmark
- Subscribe
- Mute
- Printer Friendly Page
- Mark as New
- Bookmark
- Subscribe
- Mute
- Subscribe to RSS Feed
- Permalink
- Report Inappropriate Content
CYMTD vs PYMTD in one single measure
Hi,
I want to build PIVOT table using following data:
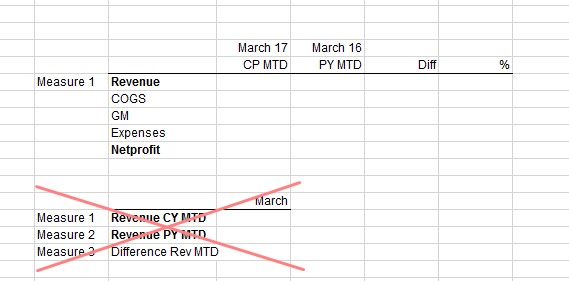
Rows: Measures
Columns: MonthYear
Measures: [Revenue]
When I choose Month and Year on the filter pane, I want the PIVOT to show me [Revenue] for:
- CYMTD in the first column
- PYMTD in the second column
- Difference in the third column
Let's say I chose MARCH and 2017. There are only 7 days with the data, the [Revenue] measure would be calculated for 1-7 days of March in 2017 vs 2016, and the difference.
So far, I was only able to create two different [Revenue] measures for CY and PY, but this does not work for me.
- Mark as New
- Bookmark
- Subscribe
- Mute
- Subscribe to RSS Feed
- Permalink
- Report Inappropriate Content
In column you can give 'Year' and Month/MonthYear Dimension and for selection give Month instead of MonthYear
- Mark as New
- Bookmark
- Subscribe
- Mute
- Subscribe to RSS Feed
- Permalink
- Report Inappropriate Content
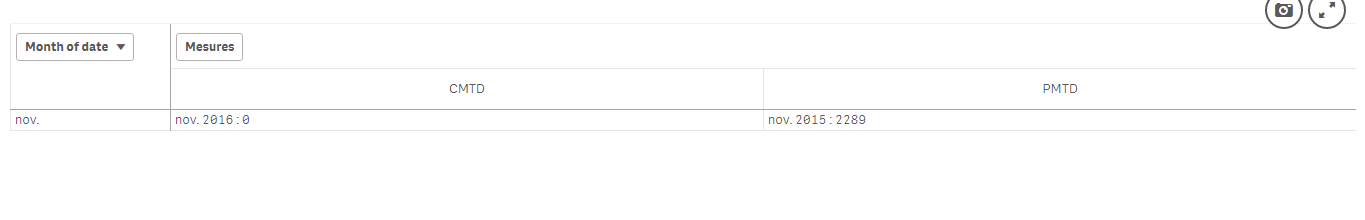
Something like this would do it?
- Mark as New
- Bookmark
- Subscribe
- Mute
- Subscribe to RSS Feed
- Permalink
- Report Inappropriate Content
I don't quite get it how it will help me with my problem. I already have MONTLY data in the layout I want.
The problem is that is can't figure out how i can get MTD numbers for the single measure and how can i get DIFFERENCE column in PIVOT (I know how to do it in table).
- Mark as New
- Bookmark
- Subscribe
- Mute
- Subscribe to RSS Feed
- Permalink
- Report Inappropriate Content
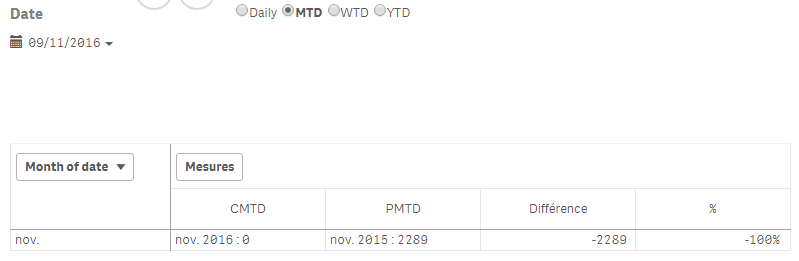
If this does the work, I can help with it
- Mark as New
- Bookmark
- Subscribe
- Mute
- Subscribe to RSS Feed
- Permalink
- Report Inappropriate Content
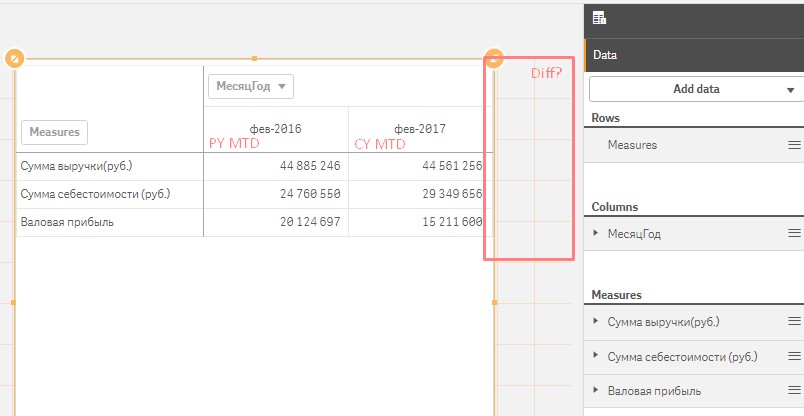
look great except i need to switch MOD and Measure, like in the screenshot above.
How did you make the difference measure, though?
- Mark as New
- Bookmark
- Subscribe
- Mute
- Subscribe to RSS Feed
- Permalink
- Report Inappropriate Content
Hi, where you able to solve this? i have the same issue, but cant work it out....
please post solution if you can
thanks Andy