Unlock a world of possibilities! Login now and discover the exclusive benefits awaiting you.
- Qlik Community
- :
- Forums
- :
- Analytics
- :
- New to Qlik Analytics
- :
- Re: Sales range as calculated dimension
- Subscribe to RSS Feed
- Mark Topic as New
- Mark Topic as Read
- Float this Topic for Current User
- Bookmark
- Subscribe
- Mute
- Printer Friendly Page
- Mark as New
- Bookmark
- Subscribe
- Mute
- Subscribe to RSS Feed
- Permalink
- Report Inappropriate Content
Sales range as calculated dimension
Hi,
Does anyone know how to make a bar chart that count the number of salesperson by sales-range as calculated dimension? Thanks.
| Salesperson | Sales in Mar |
|---|---|
| A | 300 |
| A | 1500 |
| B | 900 |
| B | 300 |
| C | 200 |
| C | 300 |
Expected result
Sales < 1000 : 1 salesperson (C)
Sales > 1000 and < 2000 : 2 salesperson (A & B)
Accepted Solutions
- Mark as New
- Bookmark
- Subscribe
- Mute
- Subscribe to RSS Feed
- Permalink
- Report Inappropriate Content
Found work around to the issue. Thanks Sunny and Omar.
- Mark as New
- Bookmark
- Subscribe
- Mute
- Subscribe to RSS Feed
- Permalink
- Report Inappropriate Content
Check my response here:
- Mark as New
- Bookmark
- Subscribe
- Mute
- Subscribe to RSS Feed
- Permalink
- Report Inappropriate Content
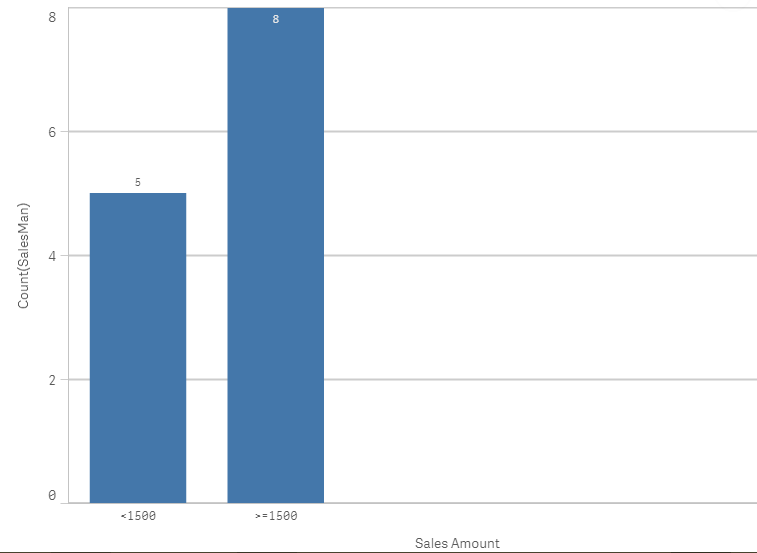
try to alter your script like this:
the in your bar chart, as dimension 'sales amount' and measure: count(salesman)
table:
load
SalesMan,
Sales
from ....
leftj join(table)
LOAD
SalesMan,
sum(Sales) as SommeSales
Resident table
Group By SalesMan;
SalesTable:
LOAD SalesMan,
Sales,
if(SommeSales<=1000,'<1000','>1000') as "Sales Amount",
Resident table;
DROP Table table;
result:
- Mark as New
- Bookmark
- Subscribe
- Mute
- Subscribe to RSS Feed
- Permalink
- Report Inappropriate Content
Thank you.
After applied modifier to the script, it turned out invalid dimension. Following is the script:
=Aggr(if(Sum({<[PRODUCTION.CATE_CODE]={'01'}, [PRODUCTION.MONTH_PERIOD]={'13'}>}[PRODUCTION.SALES] ) < 10000, 'Sales < 10000', 'Sales >= 10000'),[SalePerson])
- Mark as New
- Bookmark
- Subscribe
- Mute
- Subscribe to RSS Feed
- Permalink
- Report Inappropriate Content
I don't see anything wrong here, would you be able to share a sample where you tried this and it did not work?
- Mark as New
- Bookmark
- Subscribe
- Mute
- Subscribe to RSS Feed
- Permalink
- Report Inappropriate Content
Corrected the script, now it works. Thanks.
For salesperson without any sales record, it returns a ' - ' group. How can it combine with the 0-sales group?
Sales No. of Sales person
0 10
<100 22
- 15
- Mark as New
- Bookmark
- Subscribe
- Mute
- Subscribe to RSS Feed
- Permalink
- Report Inappropriate Content
It should fall into <100, is it not? Difficult to say without taking a look
- Mark as New
- Bookmark
- Subscribe
- Mute
- Subscribe to RSS Feed
- Permalink
- Report Inappropriate Content
Can you leave us a picture of the problem? Thanks
- Mark as New
- Bookmark
- Subscribe
- Mute
- Subscribe to RSS Feed
- Permalink
- Report Inappropriate Content
Found work around to the issue. Thanks Sunny and Omar.
- Mark as New
- Bookmark
- Subscribe
- Mute
- Subscribe to RSS Feed
- Permalink
- Report Inappropriate Content
What was the work around? Can you share that information with us?