Unlock a world of possibilities! Login now and discover the exclusive benefits awaiting you.
- Qlik Community
- :
- Forums
- :
- Analytics
- :
- New to Qlik Analytics
- :
- Re: Concatenante dim and measure in a chart (pie c...
- Subscribe to RSS Feed
- Mark Topic as New
- Mark Topic as Read
- Float this Topic for Current User
- Bookmark
- Subscribe
- Mute
- Printer Friendly Page
- Mark as New
- Bookmark
- Subscribe
- Mute
- Subscribe to RSS Feed
- Permalink
- Report Inappropriate Content
Concatenante dim and measure in a chart (pie chart)
Hi everyone ( stalwar1),
I have a pie chart,
as a dimension: Sens
as a measure: Count({<$(vSetPeriodPres),Code_Ligne={'MAL'},Groupe_Complet_Vide={c,C,G}>}Dossier)
here is the current output :
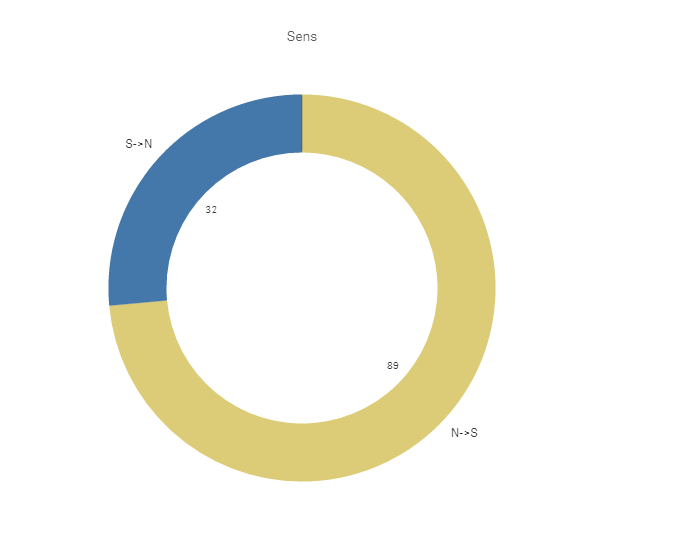
Now, what I'm trying to do is having next to N->S and S->N the % of the total.
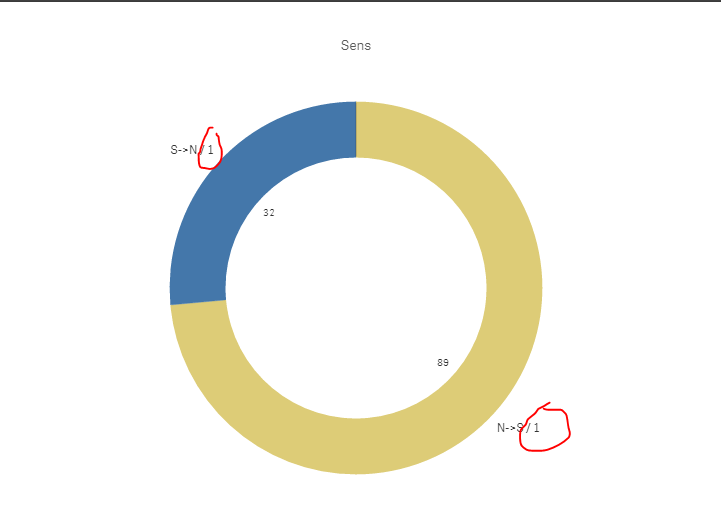
I'll then need to alter my dimension and add to it a measure :
Sens&' / '&
($(=Count({<$(vSetPeriodPres),Code_Ligne={'MAL'},Groupe_Complet_Vide={c,C,G}>}Dossier))
/
$(=Count({<$(vSetPeriodPres),Code_Ligne={'MAL'},Groupe_Complet_Vide={c,C,G}>}TOTAL Dossier)))
But this is always showing 1:
The reason for this is because the first part always returns the total and doesn't aggregate on the dimension SENS:
See: when I choose as a dimension:
Sens&' / '&
$(=Count({<$(vSetPeriodPres),Code_Ligne={'MAL'},Groupe_Complet_Vide={c,C,G}>}Dossier))
It will show 121, which is the total:(32+89)
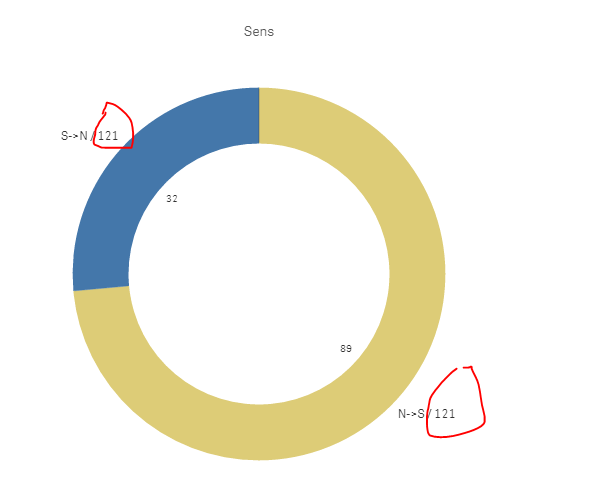
The question is, how to force this o return 89 for Sens N-S and 32 for S-N?
I also tried this:
=Sens&' / '&
Aggr($(=Count({<$(vSetPeriodPres),Code_Ligne={'MAL'},Groupe_Complet_Vide={c,C,G}>}Dossier)),Sens)
But this did not change a thing !
Thanks in advance for your help
Accepted Solutions
- Mark as New
- Bookmark
- Subscribe
- Mute
- Subscribe to RSS Feed
- Permalink
- Report Inappropriate Content
You love $ sign expansion.... don't you? Did my above expression use dollar sign expansion? Can you at least give it a shot
Aggr(
Sens&' / '&
(Count({<$(vSetPeriodPres),Code_Ligne={'MAL'},Groupe_Complet_Vide={c,C,G}>}Dossier)
/
Count({<$(vSetPeriodPres),Code_Ligne={'MAL'},Groupe_Complet_Vide={c,C,G}>}TOTAL Dossier))
, Sens)
Please note the missing dollar sign expansion 
- Mark as New
- Bookmark
- Subscribe
- Mute
- Subscribe to RSS Feed
- Permalink
- Report Inappropriate Content
Is there a reason your use dollar sign expansion? May be this is something related to Qlik Sense, but in QlikView, I would do like this
Sens&' / '&
(Count({<$(vSetPeriodPres),Code_Ligne={'MAL'},Groupe_Complet_Vide={c,C,G}>}Dossier)
/
Count({<$(vSetPeriodPres),Code_Ligne={'MAL'},Groupe_Complet_Vide={c,C,G}>}TOTAL Dossier))
- Mark as New
- Bookmark
- Subscribe
- Mute
- Subscribe to RSS Feed
- Permalink
- Report Inappropriate Content
That's exactly what I've done sunny, and It keeps on returning 1; because the first part always returns the total.
Sens&' / '&
($(=Count({<$(vSetPeriodPres),Code_Ligne={'MAL'},Groupe_Complet_Vide={c,C,G}>}Dossier))
/
$(=Count({<$(vSetPeriodPres),Code_Ligne={'MAL'},Groupe_Complet_Vide={c,C,G}>}TOTAL Dossier)))
For the $ part, Yes, in Qlik Sense, we have to call a measure with a dollar sign to use as a dimension.
If we don't write the $, it will be invalid
- Mark as New
- Bookmark
- Subscribe
- Mute
- Subscribe to RSS Feed
- Permalink
- Report Inappropriate Content
That can't be true.... can you try this:
Aggr(
Sens&' / '&
(Count({<$(vSetPeriodPres),Code_Ligne={'MAL'},Groupe_Complet_Vide={c,C,G}>}Dossier)
/
Count({<$(vSetPeriodPres),Code_Ligne={'MAL'},Groupe_Complet_Vide={c,C,G}>}TOTAL Dossier))
, Sens)
- Mark as New
- Bookmark
- Subscribe
- Mute
- Subscribe to RSS Feed
- Permalink
- Report Inappropriate Content
Here's my expression:
=Aggr( Sens&' / '&
($(=Count({<$(vSetPeriodPres),Code_Ligne={'MAL'},Groupe_Complet_Vide={c,C,G}>}Dossier))
/
$(=Count({<$(vSetPeriodPres),Code_Ligne={'MAL'},Groupe_Complet_Vide={c,C,G}>}TOTAL Dossier))),Sens)
Here is the result :
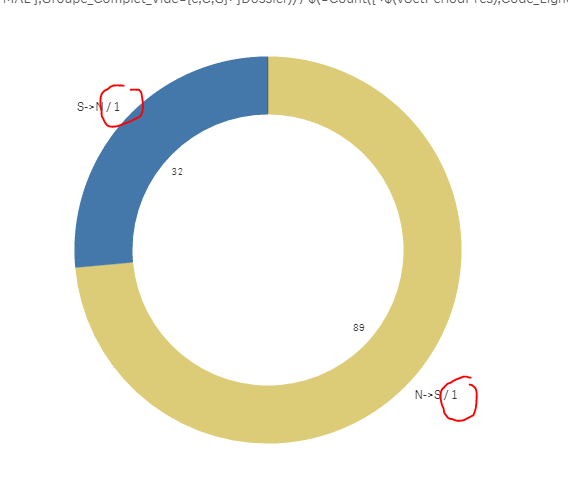
That's really odd..
- Mark as New
- Bookmark
- Subscribe
- Mute
- Subscribe to RSS Feed
- Permalink
- Report Inappropriate Content
You love $ sign expansion.... don't you? Did my above expression use dollar sign expansion? Can you at least give it a shot
Aggr(
Sens&' / '&
(Count({<$(vSetPeriodPres),Code_Ligne={'MAL'},Groupe_Complet_Vide={c,C,G}>}Dossier)
/
Count({<$(vSetPeriodPres),Code_Ligne={'MAL'},Groupe_Complet_Vide={c,C,G}>}TOTAL Dossier))
, Sens)
Please note the missing dollar sign expansion
- Mark as New
- Bookmark
- Subscribe
- Mute
- Subscribe to RSS Feed
- Permalink
- Report Inappropriate Content
Haha; Yes It works now !
My bad Sunny 