Unlock a world of possibilities! Login now and discover the exclusive benefits awaiting you.
- Qlik Community
- :
- Forums
- :
- Analytics
- :
- New to Qlik Analytics
- :
- Re: prior year
- Subscribe to RSS Feed
- Mark Topic as New
- Mark Topic as Read
- Float this Topic for Current User
- Bookmark
- Subscribe
- Mute
- Printer Friendly Page
- Mark as New
- Bookmark
- Subscribe
- Mute
- Subscribe to RSS Feed
- Permalink
- Report Inappropriate Content
prior year
Hello everyone,
I hope that you can help me. Indeed, I want display two value side by side in a bar chart, first value for the year select and second value for the prior year. I use this formula in set analysis annee={$(=(annee-10))} (10 because it's ten by ten).
But nothing display in my bar chart.
Do you have any idea to help me ?
Best regards,
SD
- « Previous Replies
-
- 1
- 2
- Next Replies »
Accepted Solutions
- Mark as New
- Bookmark
- Subscribe
- Mute
- Subscribe to RSS Feed
- Permalink
- Report Inappropriate Content
Thanks, but my formula work finally, I need to add ">" before "}".
- Mark as New
- Bookmark
- Subscribe
- Mute
- Subscribe to RSS Feed
- Permalink
- Report Inappropriate Content
Try this
annee={$(=Max(annee)-10)}
- Mark as New
- Bookmark
- Subscribe
- Mute
- Subscribe to RSS Feed
- Permalink
- Report Inappropriate Content
Values display are still values of year select only...
- Mark as New
- Bookmark
- Subscribe
- Mute
- Subscribe to RSS Feed
- Permalink
- Report Inappropriate Content
Can you show a screenshot of the field annee?
- Mark as New
- Bookmark
- Subscribe
- Mute
- Subscribe to RSS Feed
- Permalink
- Report Inappropriate Content
Yes, you can see with this picture :
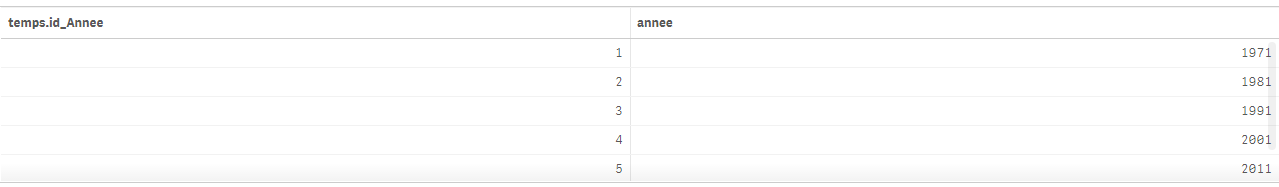
Before annee was a String but I modifiy in integer in the database and I refresh data.
- Mark as New
- Bookmark
- Subscribe
- Mute
- Subscribe to RSS Feed
- Permalink
- Report Inappropriate Content
Are you making selection in other Date and Time related fields?
- Mark as New
- Bookmark
- Subscribe
- Mute
- Subscribe to RSS Feed
- Permalink
- Report Inappropriate Content
I use your expression without and with selection on annee field. Because, I want when I will select value 1981, I want value for 1971 and 1981 side by side.
- Mark as New
- Bookmark
- Subscribe
- Mute
- Subscribe to RSS Feed
- Permalink
- Report Inappropriate Content
I try to create a variable like this anneeV : $(=annee+10). Then I use this variable in a set analysis like this : sum(${<nom_Mesure={exp}, annee={$(=anneeV)}, nom_Du_Pays-={'Monde'}} valeur).
But value display are this of current year select...
- Mark as New
- Bookmark
- Subscribe
- Mute
- Subscribe to RSS Feed
- Permalink
- Report Inappropriate Content
How about this, doesn't work?
Sum(${<nom_Mesure={exp}, annee={$(=Max(annee) - 10)}, nom_Du_Pays-={'Monde'}} valeur)
- Mark as New
- Bookmark
- Subscribe
- Mute
- Subscribe to RSS Feed
- Permalink
- Report Inappropriate Content
Try this:
Sum({<annee=,annee={"$(=max(annee))","$(=max(annee)-5)"}>}YourMeasure)
- « Previous Replies
-
- 1
- 2
- Next Replies »