Unlock a world of possibilities! Login now and discover the exclusive benefits awaiting you.
- Qlik Community
- :
- Forums
- :
- Analytics
- :
- New to Qlik Analytics
- :
- Re: Create multiple lines in one line chart (not c...
- Subscribe to RSS Feed
- Mark Topic as New
- Mark Topic as Read
- Float this Topic for Current User
- Bookmark
- Subscribe
- Mute
- Printer Friendly Page
- Mark as New
- Bookmark
- Subscribe
- Mute
- Subscribe to RSS Feed
- Permalink
- Report Inappropriate Content
Create multiple lines in one line chart (not column ) and drill down function
Hi, here is the data set
1. wondering could I create a line chart, having Month as dimension. but Segment or Prod_type as each line (only choose one each time)
say. . dimension: Month
having 8 lines: for 8 Segment: MNC, SME.... have Sum(CLS_STK) as measure? (need to aggregate there are several MNC for each month)
and have 8 lines have different color
how could I do that?
then if use
dimension: Month
each product type as each line
How could I do that?
2. when we talk to drill down, could we also create a drill down for this sheet?
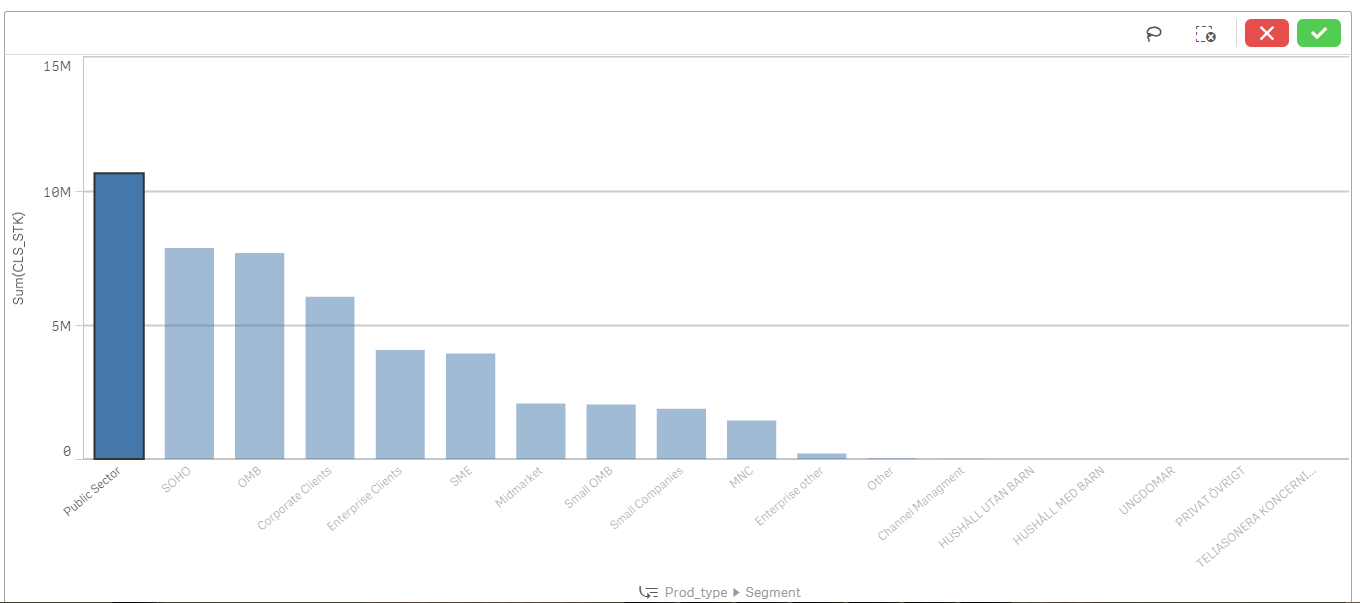
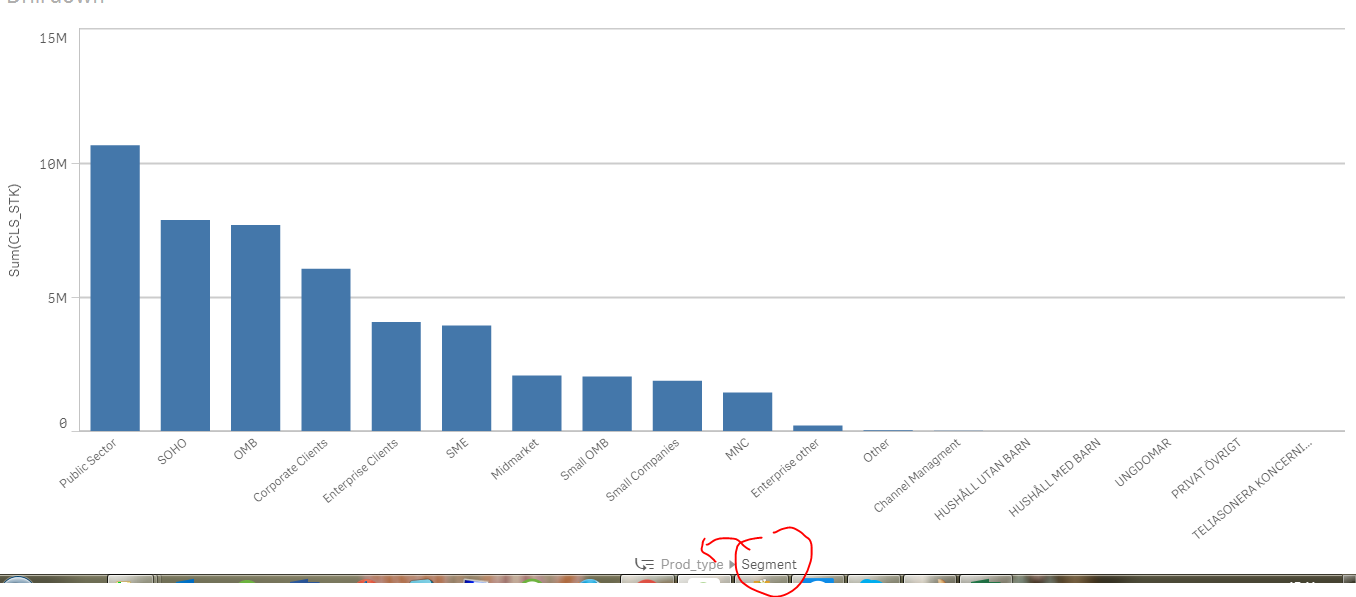
say, the product_type is the first level and the Segment is the second level`? if we can how could we do that?
or we can not create a drill down function, because each product have same 8 segement tagw, so we can only use filter function?
3. could I also create a combom chart having
Month as Dimension
have only Fix broadband as object (do not need to show other product time)
Sum of Sum(CLS_STK) as the measure(the bar) and the point for each month is average of Sum(AVTN_CNT)
Thank you so much!!
- Mark as New
- Bookmark
- Subscribe
- Mute
- Subscribe to RSS Feed
- Permalink
- Report Inappropriate Content
For creating Drill down dimensions:
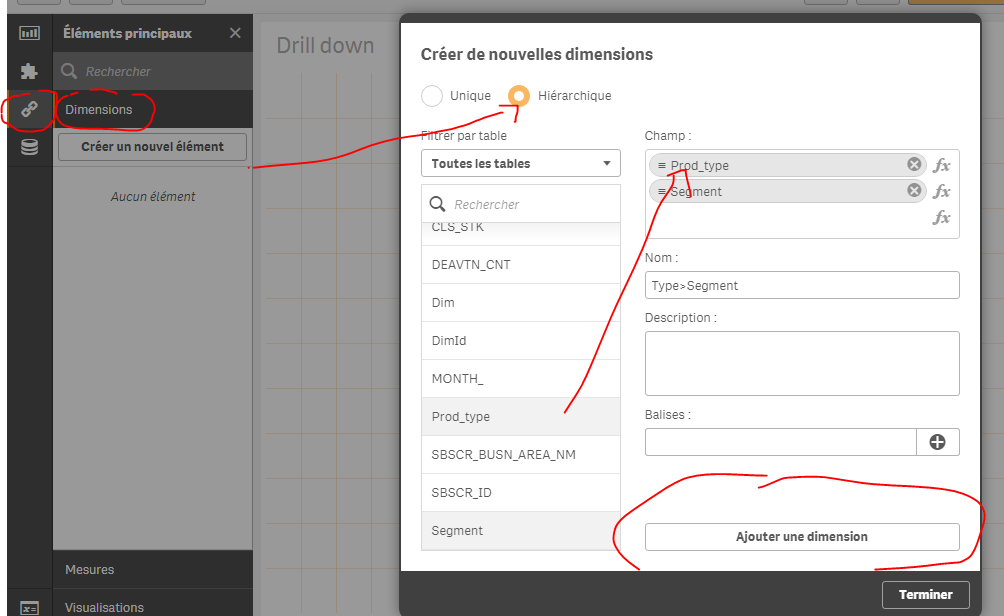
Then use it s a dimension in a graphic:
For your first question, create a table inline as follow:
load * Inline [
DimId, Dim
1, Segment
2, ProdType
];
Then create a variable named vDim for example : if(DimId=1,Segment,Prod_type)
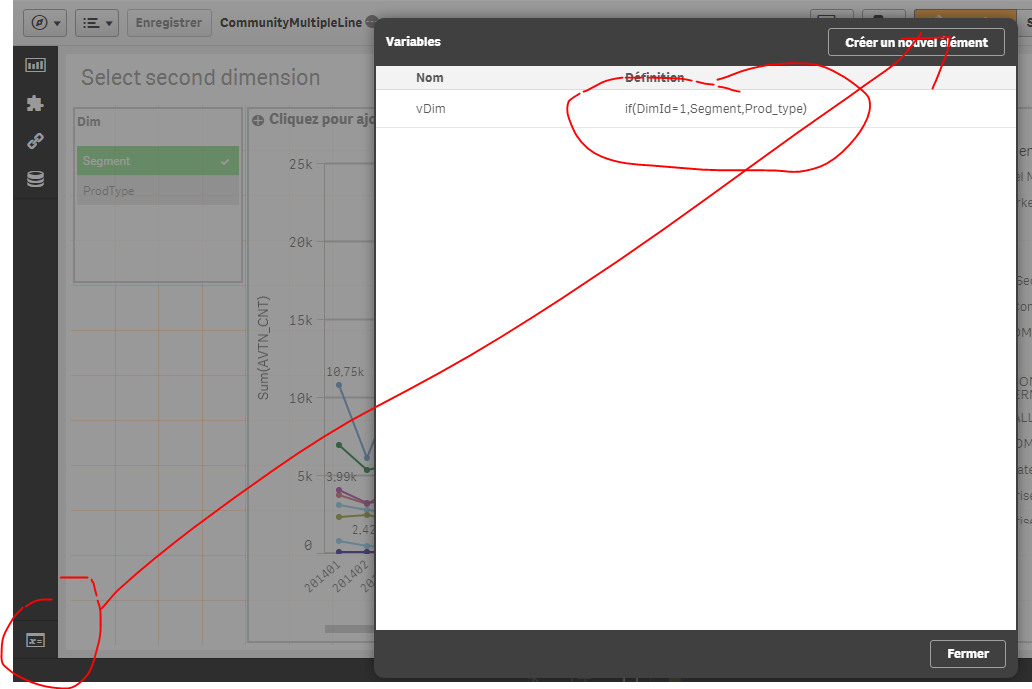
Then select a line chart, as dimension 1 : Month
As dimension 2: call you variable that depends on the selection of segment or prodType (the 2 fields we created with the inline table): $(vDim)
and your measure:
See the attached app:
- Mark as New
- Bookmark
- Subscribe
- Mute
- Subscribe to RSS Feed
- Permalink
- Report Inappropriate Content
Thank you so much. But if could have more info about the second halve will be good.
so 1. I need to go to data loading manager create a table by using this sentence>
load * Inline [
DimId, Dim
1, Segment
2, ProdType
];
2.Then I go back to app, create the vDim variable
then 3. create the line chart
dimension 1: Month
dimension 2: $(vDim)
(exacty the same typing?)
or?
Thank you.
I tried out the simple way, just add 2 dimensions in the line chart.
create 2 graphs.
Graph 1: 1. month 2. Segment
Graph 2: 1 month 2. prod_type
seems work. Do you think that is fine? Thank you!