Unlock a world of possibilities! Login now and discover the exclusive benefits awaiting you.
- Qlik Community
- :
- Forums
- :
- Analytics
- :
- App Development
- :
- Data disappears on Year selection
- Subscribe to RSS Feed
- Mark Topic as New
- Mark Topic as Read
- Float this Topic for Current User
- Bookmark
- Subscribe
- Mute
- Printer Friendly Page
- Mark as New
- Bookmark
- Subscribe
- Mute
- Subscribe to RSS Feed
- Permalink
- Report Inappropriate Content
Data disappears on Year selection
Hello Everyone,
I've got a strange issue whereby my data is disappearing from my chart when I select a year. With nothing selected, the Max(Year) =2017 and I get a chart like this.
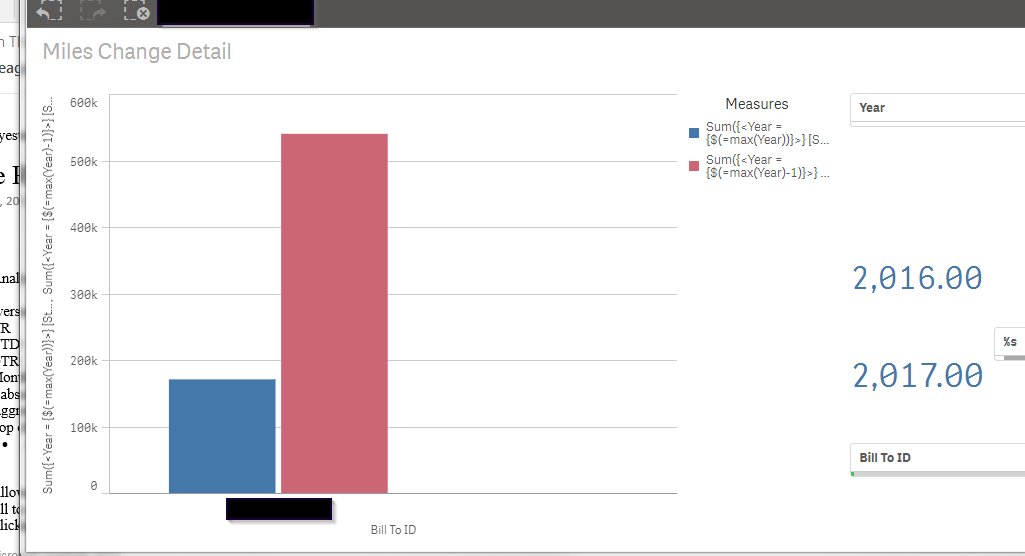
If you look to the right, you can see that I've got a spot for the result of Max(Year) - 1 and Max(Year). However, as soon as I select the Year [2017] from a filter list, all of the data that should show based on Max(Year) - 1 disappears.
My bar chart Expressions look like this
Sum({<Year = {$(=max(Year))}>} [Stop Leg Mileage])
for the current year, and
Sum({<Year = {$(=max(Year)-1)}>} [Stop Leg Mileage])
for the previous year.
Generally, when data falls away, it means that you haven't linked in correctly, but I've verified that the data does exist.
Any help is greatly appreciated.
- Mark as New
- Bookmark
- Subscribe
- Mute
- Subscribe to RSS Feed
- Permalink
- Report Inappropriate Content
The data does appear when I add a '1' to the front of my Set Analysis. I went from
Sum({<Year = {$(=max(Year)-1)}>} [Stop Leg Mileage])
to Sum({1<Year = {$(=max(Year)-1)}>} [Stop Leg Mileage])
and it works fine. I guess what was happening was that when the Year was selected, the data pertaining to 'Year-1' was excluded. The 1 tells the system to ignore the Year selections made by the user.