Unlock a world of possibilities! Login now and discover the exclusive benefits awaiting you.
- Qlik Community
- :
- Forums
- :
- Analytics
- :
- New to Qlik Analytics
- :
- waterfall chart/similar chart to show yearly tren...
- Subscribe to RSS Feed
- Mark Topic as New
- Mark Topic as Read
- Float this Topic for Current User
- Bookmark
- Subscribe
- Mute
- Printer Friendly Page
- Mark as New
- Bookmark
- Subscribe
- Mute
- Subscribe to RSS Feed
- Permalink
- Report Inappropriate Content
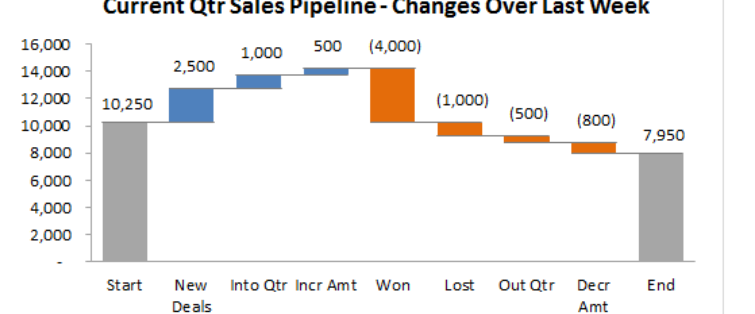
waterfall chart/similar chart to show yearly trend with 3 measures
Hi I am trying to show this below data in waterfall way, but the extensions have only 1 measure limitation. Can we do this using regular barchart or any other way?
here is my sample data
| year | measure1 | measure2 | measure3 |
| 2015 | 74k | 10989 | 4908 |
| 2016 | 74k | 2090 | 578 |
| 2017 | 71k | 3789 | 3489 |
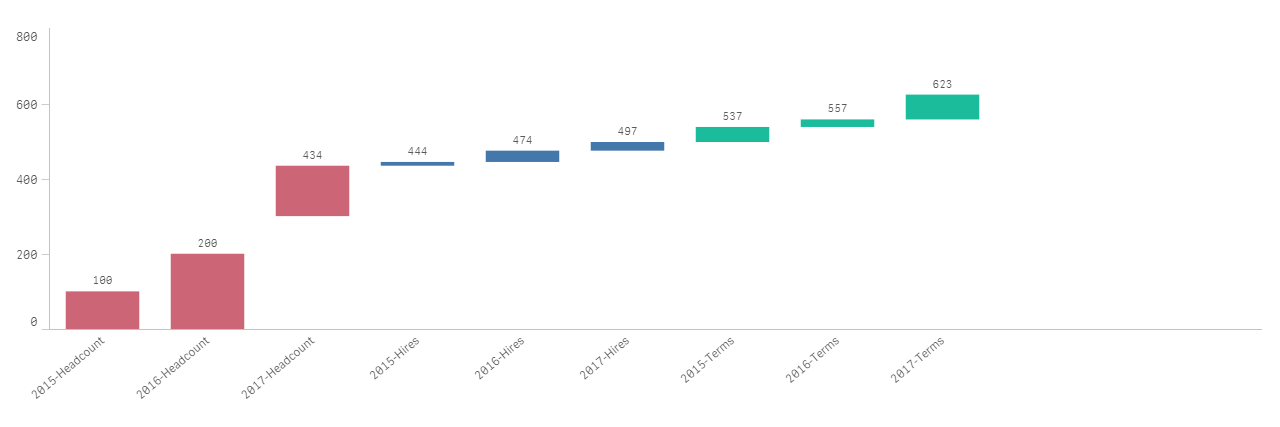
I would like to see as in below image or any other similar way(Like all blues are measure 2 for 3 years, ). Is this possible? thanks much.
- Mark as New
- Bookmark
- Subscribe
- Mute
- Subscribe to RSS Feed
- Permalink
- Report Inappropriate Content
Have a look at this.
- Mark as New
- Bookmark
- Subscribe
- Mute
- Subscribe to RSS Feed
- Permalink
- Report Inappropriate Content
Andy, thankyou for the link. it is very helpful.
however i could not load my excel data ! !from my c drive for the dynamic waterfall.
and I tried static way , I think i see group what i want but i want different colors for different measures. which i couldn't achieve.
please see attached qvf. if you can tell me what i have done incorrect.
also do you have more info on multiplier and offset concept. i didnt understand clearly how set up and why?
thanks again for your time.
- Mark as New
- Bookmark
- Subscribe
- Mute
- Subscribe to RSS Feed
- Permalink
- Report Inappropriate Content
If you are using 3.2 you should be able to set your custom colors if you set your measure as a master item.
The offset is what makes your measure display above or below the 0 axis.
I'll have a play with it tomorrow and see what I can get going
Regards
Andy
- Mark as New
- Bookmark
- Subscribe
- Mute
- Subscribe to RSS Feed
- Permalink
- Report Inappropriate Content
Thankyou, I tried this for color expression .no luck.
if(Dim = 'Offset',ARGB(0,0,0,0),
Pick(Match(Static, 'Headcount', 'Hires', 'Terms'),
RGB(204,102,119), RGB(68,119,170), RGB(26, 188, 156)))
- Mark as New
- Bookmark
- Subscribe
- Mute
- Subscribe to RSS Feed
- Permalink
- Report Inappropriate Content
almost there with the colour. you need to use the wildmatch function to identify the colour as you have year also in your name. This should fix the colour
if(Dim = 'Offset',ARGB(0,0,0,0),
Pick(WildMatch(Static, '*Headcount', '*Hires', '*Terms'),
RGB(204,102,119), RGB(68,119,170), RGB(26, 188, 156)))
The multiplier detirmines if your value axis start point based on the last value. 1=Ontop, -1 means Below, 0=same level
I hope this helps.
Regards
Andy
- Mark as New
- Bookmark
- Subscribe
- Mute
- Subscribe to RSS Feed
- Permalink
- Report Inappropriate Content
yes it worked. .Thank you so much, your guidance and time are much appreciated !.
!.
I understand the concept now.
Prana.
- Mark as New
- Bookmark
- Subscribe
- Mute
- Subscribe to RSS Feed
- Permalink
- Report Inappropriate Content
No problem, glad I could help.