Unlock a world of possibilities! Login now and discover the exclusive benefits awaiting you.
- Qlik Community
- :
- Forums
- :
- Analytics
- :
- App Development
- :
- Colour by expression on single colours
- Subscribe to RSS Feed
- Mark Topic as New
- Mark Topic as Read
- Float this Topic for Current User
- Bookmark
- Subscribe
- Mute
- Printer Friendly Page
- Mark as New
- Bookmark
- Subscribe
- Mute
- Subscribe to RSS Feed
- Permalink
- Report Inappropriate Content
Colour by expression on single colours
I have a line chart with two expressions, is there a way I can colour each expression with two different single colours?
- « Previous Replies
-
- 1
- 2
- Next Replies »
Accepted Solutions
- Mark as New
- Bookmark
- Subscribe
- Mute
- Subscribe to RSS Feed
- Permalink
- Report Inappropriate Content
Thanks Taj, this is the answer.
You have to be using Qlik Sense 3.2 (if not, please upgrade)to be able to affect color to master measures:
Below, I'll be creating 2 master measures: sum("car sales") and sum("commercial vehicle sales"):


- Mark as New
- Bookmark
- Subscribe
- Mute
- Subscribe to RSS Feed
- Permalink
- Report Inappropriate Content
on the expression background color you can try like
=if(sum(Sales)>=5000,Green(),if(sum(Sales)<=4999,Red()))
- Mark as New
- Bookmark
- Subscribe
- Mute
- Subscribe to RSS Feed
- Permalink
- Report Inappropriate Content
Hi Taj, that's not what i want to do. I have two expression:
1. Sum([Home Yellow]) + Sum([Away Yellow])
2. Sum([Home Red])+Sum([Away Red])
I want to colour the first expression as yellow and second expression as red. Now i've tried
if((Sum([Home Yellow]) + Sum([Away Yellow])), rgb (255,0,0), if((Sum([Home Red])+Sum([Away Red])),rgb (0,255,0)))
I've also tried
if((Sum([Home Yellow]) + Sum([Away Yellow]))=(Sum([Home Yellow]) + Sum([Away Yellow])),yellow(),if((Sum([Home Red])+Sum([Away Red]))<=(Sum([Home Red])+Sum([Away Red])),Red()))
They both don't work.
Regards,
Vic
- Mark as New
- Bookmark
- Subscribe
- Mute
- Subscribe to RSS Feed
- Permalink
- Report Inappropriate Content
on the properties>colors tab, you can change colour 1 and 2 and also you have the option to define rgb values
- Mark as New
- Bookmark
- Subscribe
- Mute
- Subscribe to RSS Feed
- Permalink
- Report Inappropriate Content
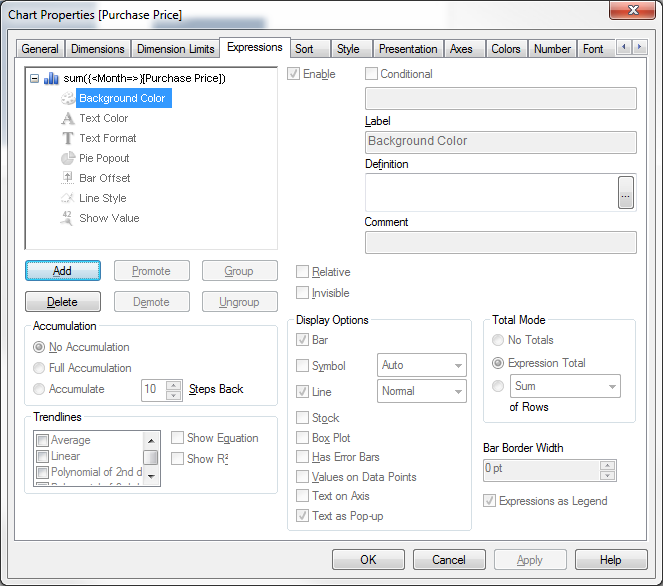
On expression background set:
rgb (255,0,0) //(for Sum([Home Yellow]) + Sum([Away Yellow]) expression)
rgb (0,255,0) //(for Sum([Home Red])+Sum([Away Red]) expression )
If a post helps to resolve your issue, please accept it as a Solution.
- Mark as New
- Bookmark
- Subscribe
- Mute
- Subscribe to RSS Feed
- Permalink
- Report Inappropriate Content
This is on Qliksense btw
- Mark as New
- Bookmark
- Subscribe
- Mute
- Subscribe to RSS Feed
- Permalink
- Report Inappropriate Content
This Qlikview, i'm talking about the ability to do this on Qliksense
- Mark as New
- Bookmark
- Subscribe
- Mute
- Subscribe to RSS Feed
- Permalink
- Report Inappropriate Content
Create a dimension using valuelist(),
Valuelist('Home Yellow + Away Yellow','Home Red + Away Red')
then create 1 expression:
1. if(rowno()=1,
Sum([Home Yellow]) + Sum([Away Yellow]),
Sum([Home Red])+Sum([Away Red])
)
then under "Aspect->Colors" use "color by expression" and write:
if(rowno()=1,rgb (255,0,0),rgb (0,255,0))
If a post helps to resolve your issue, please accept it as a Solution.
- Mark as New
- Bookmark
- Subscribe
- Mute
- Subscribe to RSS Feed
- Permalink
- Report Inappropriate Content
Hi, it's a line chart and the only dimension is 'Months'. How will creating a valuelist dimension solve this?
- Mark as New
- Bookmark
- Subscribe
- Mute
- Subscribe to RSS Feed
- Permalink
- Report Inappropriate Content
- « Previous Replies
-
- 1
- 2
- Next Replies »