Unlock a world of possibilities! Login now and discover the exclusive benefits awaiting you.
- Qlik Community
- :
- Forums
- :
- Analytics
- :
- New to Qlik Analytics
- :
- Re: Expression for count if the average is greater...
- Subscribe to RSS Feed
- Mark Topic as New
- Mark Topic as Read
- Float this Topic for Current User
- Bookmark
- Subscribe
- Mute
- Printer Friendly Page
- Mark as New
- Bookmark
- Subscribe
- Mute
- Subscribe to RSS Feed
- Permalink
- Report Inappropriate Content
Expression for count if the average is greater than target number
I'm trying to create expressions for a KPI object based off information shown in this chart:
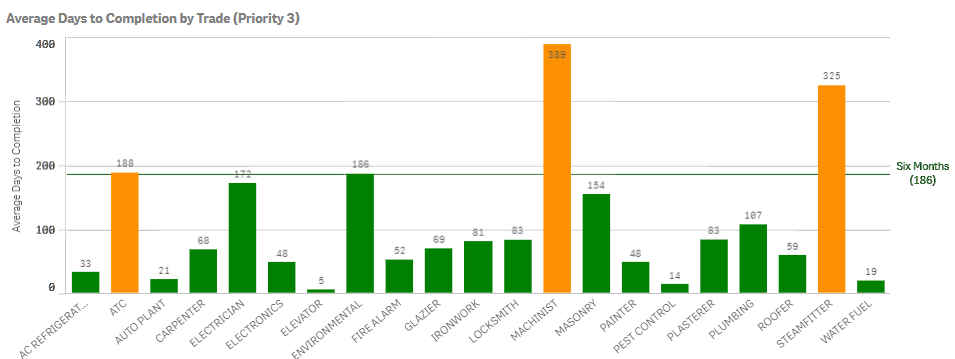
This is the average time it takes to complete a Priority 3 Work Order, by Trade, with a reference line showing where 6 months is, as the average time should be less than 6 months. I'm been tasked with created a KPI object showing:
1) % of Trades Meeting this Target [Ex: 18/21 = 86%)
2) # of Trades Meeting this Target [Ex: 18]
3) # of Trades not Meeting this Target [ Ex: 3]
I believe I'm going to need to create three expressions, and therefor three measures using the KPI chart.
I started so far for 1 tried to create an expression like:
Count(Aggr(avg({$<[PRIORITY]={'3'},[DAYSTOCOMPLETE]={'>-1 and <=186'}>}DAYSTOCOMPLETE)/
avg({$<[PRIORITY]={'3'},[DAYSTOCOMPLETE]={'>186'}>}DAYSTOCOMPLETE)),[WORK_TEAM_ID]))
...but it's invalid. Basically I need to determine if a trade is coming in under or equal to the target for days to complete a work order, and then the count of those trades , the count of if they aren't meeting the target, and the percent that are meeting the target.
Thanks for any help!
- « Previous Replies
-
- 1
- 2
- Next Replies »
- Mark as New
- Bookmark
- Subscribe
- Mute
- Subscribe to RSS Feed
- Permalink
- Report Inappropriate Content
Can you share the expressions of your chart? Both the expression for bar and the 6 month reference line
- Mark as New
- Bookmark
- Subscribe
- Mute
- Subscribe to RSS Feed
- Permalink
- Report Inappropriate Content
First, I'd arrange to add a field to your data model that will flag each fact (trade) met the target or not. This will simplify your set analysis. You should also have a counter field on the trade fact with a 1 for each unique trade, allowing you to sum the counter field rather than use a count() function.
Your example formula likely doesn't work. It's first doing the average days to complete for the 18 trades that met the target, dividing by the average days to complete for just the 3 trades that did not meet the target, and then it's counting how many unique averages you have for each work team ID. My guess is the result is the number of work teams.
I'm not sure why you need to aggregate by Work Team ID. If you don't need the aggregation, the formula might be something like: count({$<[PRIORITY]={'3'},[DAYSTOCOMPLETE]={'>-1 and <=186'}>} TRADE ID)/
count({$<[PRIORITY]={'3'}>} TRADE ID)
- Mark as New
- Bookmark
- Subscribe
- Mute
- Subscribe to RSS Feed
- Permalink
- Report Inappropriate Content
Reference line is: =365
Chart is: Avg({$<[PRIORITY]={'3'}, STATUS_GROUP={'Closed'},[DAYSTOCOMPLETE]={'>-1'}>}DAYSTOCOMPLETE)
- Mark as New
- Bookmark
- Subscribe
- Mute
- Subscribe to RSS Feed
- Permalink
- Report Inappropriate Content
Adding a flag in the data model as to whether or not the target was met wouldn't work because this table is based on a filter of year. It will change depending upon the time frame filtered, as will if they met the target or not.
Each trade has a unique name [WORK_TEAM_ID]. It's not a number, however.
I don't know if the aggr() function was needed, I was just trying different things. But yea, my expression was dividing only by 3trades, it would need to be total trades.
The formula you suggested wouldn't give me what I need. It would give me a count of trades where the days to complete is less than the target, but I need to use the average days to complete and compare that to the target, and then a count of the trades where their average days to complete falls under the target.
I can't hard code in to count a total of trades because there were different trades for different years, so it would be off. I essentially need an expression for this:
[Count of Trades Whose Average Number of Days is <=Target]
[Count of Trades Whose Average Number of Days is <=Target] + [Count of Trades Whose Average Number of Days is >Target]
And expressions for:
[Count of Trades Whose Average Number of Days is <=Target]
[Count of Trades Whose Average Number of Days is >Target]
Does that help?
- Mark as New
- Bookmark
- Subscribe
- Mute
- Subscribe to RSS Feed
- Permalink
- Report Inappropriate Content
So I don't really understand the target. The target varies by year? Or the target varies based on the dates selected in the application? In your example, the target was hardcoded to be <= 186.
Other question: Can a given trade have multiple days to complete that need to be averaged?
- Mark as New
- Bookmark
- Subscribe
- Mute
- Subscribe to RSS Feed
- Permalink
- Report Inappropriate Content
No the target varies based on Priority. It won't change and there's only 4 priorities. Priority 1 <1 Day, Priority 2<2 Weeks, Priority 3<6 Months, Priority 4< 1 Year.
That won't change.
Other question: I don't understand. DAYTOCOMPLETE is a field that provides the number of days between completed and created date, per work order. Each work order also has an associated trade.
- Mark as New
- Bookmark
- Subscribe
- Mute
- Subscribe to RSS Feed
- Permalink
- Report Inappropriate Content
So the next thing to verify what "Average Number of Days" is for a trade. It suggests that you have multiple "DAYS_TO_COMPLETE" for a single trade. Is that right?
If so, I'd consider creating a temporary table in your data model at the Trade level of detail along the lines of:
TempTrades:
Load
WORK_TEAM_ID
, avg(DAYS_TO_COMPLETE) as [Avg Days To Complete]
Resident FactTable
then move the Avg Days to Complete back to the Fact table:
Left Join (FactTable)
Load WORK_TEAM_ID,
[Avg Days To Complete]
resident TempTrades;
Then clean up the data model by dropping the TempTrades table.
You could further enhance the scripting to set a "Met Target Completion Days" Flag along the lines of:
if(PRIORITY=1 and [Avg Days To Complete]<=1, 'Y',
if(PRIORITY=2 and [Avg Days To Complete] <=14, 'Y',
if(PRIORITY=3 and [Avg Days To Complete] <186,'Y',
if(PRIORITY=4 and [Avg Days To Complete] >365.25,'Y','N')))) as [Trade Met Target Flag]
Does this make sense?
If it does make sense, I think your expressions would be defined as:
[Count of Trades Whose Average Number of Days is <=Target] = count ${<[Trade Met Target Flag] = {'Y'}>}([WORK_TEAM_ID]
[Count of Trades Whose Average Number of Days is >Target] = count ${<[Trade Met Target Flag] = {'N'}>}([WORK_TEAM_ID].
And your [county of All Trades] = count([WORK_TEAM_ID]);
If needed, your could add:
[Average # of Days for Trades that Met Target] = avg(${<[Trade Met Target Flag] = {'Y'}>} DAYS_TO_COMPLETE)
- Mark as New
- Bookmark
- Subscribe
- Mute
- Subscribe to RSS Feed
- Permalink
- Report Inappropriate Content
That looks in the right direction. Let me try it out!
- Mark as New
- Bookmark
- Subscribe
- Mute
- Subscribe to RSS Feed
- Permalink
- Report Inappropriate Content
FYI, You'll need a group by when you take the average...
TempTrades:
Load
WORK_TEAM_ID
, avg(DAYS_TO_COMPLETE) as [Avg Days To Complete]
Resident FactTable
Group by WORK_TEAM_ID.
Rookie mistake by me leaving that out....
- « Previous Replies
-
- 1
- 2
- Next Replies »