Unlock a world of possibilities! Login now and discover the exclusive benefits awaiting you.
- Qlik Community
- :
- Forums
- :
- Analytics
- :
- New to Qlik Analytics
- :
- Re: Create a forecast based on seasonal curve and ...
- Subscribe to RSS Feed
- Mark Topic as New
- Mark Topic as Read
- Float this Topic for Current User
- Bookmark
- Subscribe
- Mute
- Printer Friendly Page
- Mark as New
- Bookmark
- Subscribe
- Mute
- Subscribe to RSS Feed
- Permalink
- Report Inappropriate Content
Create a forecast based on seasonal curve and historical data
Hi, I am tracking data that is seasonal with some fluctuations. I'd like to have my seasonal model as a table in Qlik Sense and update actual as they come in. As new actuals are added, would like to automatically update the forecast based on the predefined curve.

Blue line, right axis is the seasonal curve. Orange/left is actual data. Integral under the blue curve is 1 (100% of the seasons volume). What I want is to sum the last four data points of actuals, divide by the sum of the corresponding four points of curve, and use that factor to multiply the curve going forward, creating an estimate line:

Any ideas on how to approach this?
- « Previous Replies
-
- 1
- 2
- Next Replies »
Accepted Solutions
- Mark as New
- Bookmark
- Subscribe
- Mute
- Subscribe to RSS Feed
- Permalink
- Report Inappropriate Content
May be like this
If(Sum(Actual) <> 0, Sum(Actual),
Sum(Curve)*
Sum(TOTAL {<WE = {"$(='>=' & Date(Max({<Actual = {'*'}>}WE, 4)) & '<=' & Date(Max({<Actual = {'*'}>}WE)))"}>}Actual)/Sum(TOTAL {<WE = {"$(='>=' & Date(Max({<Actual = {'*'}>}WE, 4)) & '<=' & Date(Max({<Actual = {'*'}>}WE)))"}>}Curve))
- Mark as New
- Bookmark
- Subscribe
- Mute
- Subscribe to RSS Feed
- Permalink
- Report Inappropriate Content
I think it should be possible, but it might help to test it out to give you the exact solution. Would you be able to share a sample to look at this?
- Mark as New
- Bookmark
- Subscribe
- Mute
- Subscribe to RSS Feed
- Permalink
- Report Inappropriate Content
| WE | Curve | Actual |
| 1/1/2017 | 0.0095638 | 7933 |
| 1/8/2017 | 0.0136626 | 8561 |
| 1/15/2017 | 0.0136626 | 13005 |
| 1/22/2017 | 0.0136626 | 11173 |
| 1/29/2017 | 0.0136626 | 12566 |
| 2/5/2017 | 0.0136626 | 11942 |
| 2/12/2017 | 0.0136626 | 13304 |
| 2/19/2017 | 0.0136626 | 14042 |
| 2/26/2017 | 0.0136626 | 13126 |
| 3/5/2017 | 0.0153227 | 13995 |
| 3/12/2017 | 0.0169828 | 15050 |
| 3/19/2017 | 0.0186429 | 16228 |
| 3/26/2017 | 0.020303 | 17637 |
| 4/2/2017 | 0.021963 | 16836 |
| 4/9/2017 | 0.0236231 | 18015 |
| 4/16/2017 | 0.0236231 | 18909 |
| 4/23/2017 | 0.0236231 | 18914 |
| 4/30/2017 | 0.0236231 | 18252 |
| 5/7/2017 | 0.0236231 | 19261 |
| 5/14/2017 | 0.0236231 | 18360 |
| 5/21/2017 | 0.0236231 | 18505 |
| 5/28/2017 | 0.0236231 | 17779 |
| 6/4/2017 | 0.0213553 | 16092 |
| 6/11/2017 | 0.0236231 | |
| 6/18/2017 | 0.0236231 | |
| 6/25/2017 | 0.0236231 | |
| 7/2/2017 | 0.0236231 | |
| 7/9/2017 | 0.0188985 | |
| 7/16/2017 | 0.0219303 | |
| 7/23/2017 | 0.0219303 | |
| 7/30/2017 | 0.0219303 | |
| 8/6/2017 | 0.0219303 | |
| 8/13/2017 | 0.0219303 | |
| 8/20/2017 | 0.0219303 | |
| 8/27/2017 | 0.0219303 | |
| 9/3/2017 | 0.0219303 | |
| 9/10/2017 | 0.019825 | |
| 9/17/2017 | 0.0214776 | |
| 9/24/2017 | 0.0214776 | |
| 10/1/2017 | 0.0214776 | |
| 10/8/2017 | 0.0214776 | |
| 10/15/2017 | 0.0204341 | |
| 10/22/2017 | 0.0193905 | |
| 10/29/2017 | 0.018347 | |
| 11/5/2017 | 0.0173034 | |
| 11/12/2017 | 0.0162599 | |
| 11/19/2017 | 0.0152163 | |
| 11/26/2017 | 0.0094485 | |
| 12/3/2017 | 0.0141728 | |
| 12/10/2017 | 0.0141728 | |
| 12/17/2017 | 0.0141728 | |
| 12/24/2017 | 0.0141728 | |
| 12/31/2017 | 0.0099209 |
- Mark as New
- Bookmark
- Subscribe
- Mute
- Subscribe to RSS Feed
- Permalink
- Report Inappropriate Content
Might help to know what the expected output is in numerical terms based on the sample provided.... Also, for dimension are you using MonthStart or are you using continuous axis?
- Mark as New
- Bookmark
- Subscribe
- Mute
- Subscribe to RSS Feed
- Permalink
- Report Inappropriate Content
Edit - Attached excel file.
Estimate column attached. Continuous axis. Dates are week ending, cannot generate a real monthly chart from this data.
There's a couple of ways of creating the estimate line that don't produce exactly the same results - so matching this perfectly isn't necessary, I'm just looking for a framework to get started, if that makes sense.
| WE | Curve | Actual | Estimate |
| 1/1/2017 | 0.009563826 | 7933 | 7933 |
| 1/8/2017 | 0.013662608 | 8561 | 8561 |
| 1/15/2017 | 0.013662608 | 13005 | 13005 |
| 1/22/2017 | 0.013662608 | 11173 | 11173 |
| 1/29/2017 | 0.013662608 | 12566 | 12566 |
| 2/5/2017 | 0.013662608 | 11942 | 11942 |
| 2/12/2017 | 0.013662608 | 13304 | 13304 |
| 2/19/2017 | 0.013662608 | 14042 | 14042 |
| 2/26/2017 | 0.013662608 | 13126 | 13126 |
| 3/5/2017 | 0.015322695 | 13995 | 13995 |
| 3/12/2017 | 0.016982781 | 15050 | 15050 |
| 3/19/2017 | 0.018642867 | 16228 | 16228 |
| 3/26/2017 | 0.020302953 | 17637 | 17637 |
| 4/2/2017 | 0.02196304 | 16836 | 16836 |
| 4/9/2017 | 0.023623126 | 18015 | 18015 |
| 4/16/2017 | 0.023623126 | 18909 | 18909 |
| 4/23/2017 | 0.023623126 | 18914 | 18914 |
| 4/30/2017 | 0.023623126 | 18252 | 18252 |
| 5/7/2017 | 0.023623126 | 19261 | 19261 |
| 5/14/2017 | 0.023623126 | 18360 | 18360 |
| 5/21/2017 | 0.023623126 | 18505 | 18505 |
| 5/28/2017 | 0.023623126 | 17779 | 17779 |
| 6/4/2017 | 0.021355306 | 16092 | 16092 |
| 6/11/2017 | 0.023623126 | 0 | 18118.85246 |
| 6/18/2017 | 0.023623126 | 0 | 18118.85246 |
| 6/25/2017 | 0.023623126 | 0 | 18118.85246 |
| 7/2/2017 | 0.023623126 | 0 | 18118.85246 |
| 7/9/2017 | 0.018898501 | 0 | 14495.08197 |
| 7/16/2017 | 0.021930299 | 0 | 16820.46011 |
| 7/23/2017 | 0.021930299 | 0 | 16820.46011 |
| 7/30/2017 | 0.021930299 | 0 | 16820.46011 |
| 8/6/2017 | 0.021930299 | 0 | 16820.46011 |
| 8/13/2017 | 0.021930299 | 0 | 16820.46011 |
| 8/20/2017 | 0.021930299 | 0 | 16820.46011 |
| 8/27/2017 | 0.021930299 | 0 | 16820.46011 |
| 9/3/2017 | 0.021930299 | 0 | 16820.46011 |
| 9/10/2017 | 0.01982499 | 0 | 15205.69594 |
| 9/17/2017 | 0.021477636 | 0 | 16473.26964 |
| 9/24/2017 | 0.021477636 | 0 | 16473.26964 |
| 10/1/2017 | 0.021477636 | 0 | 16473.26964 |
| 10/8/2017 | 0.021477636 | 0 | 16473.26964 |
| 10/15/2017 | 0.020434084 | 0 | 15672.86845 |
| 10/22/2017 | 0.019390531 | 0 | 14872.46727 |
| 10/29/2017 | 0.018346978 | 0 | 14072.06608 |
| 11/5/2017 | 0.017303425 | 0 | 13271.6649 |
| 11/12/2017 | 0.016259873 | 0 | 12471.26371 |
| 11/19/2017 | 0.01521632 | 0 | 11670.86253 |
| 11/26/2017 | 0.009448511 | 0 | 7246.974227 |
| 12/3/2017 | 0.014172767 | 0 | 10870.46134 |
| 12/10/2017 | 0.014172767 | 0 | 10870.46134 |
| 12/17/2017 | 0.014172767 | 0 | 10870.46134 |
| 12/24/2017 | 0.014172767 | 0 | 10870.46134 |
| 12/31/2017 | 0.009920937 | 0 | 7609.322938 |
- Mark as New
- Bookmark
- Subscribe
- Mute
- Subscribe to RSS Feed
- Permalink
- Report Inappropriate Content
May be like this
If(Sum(Actual) <> 0, Sum(Actual),
Sum(Curve)*
Sum(TOTAL {<WE = {"$(='>=' & Date(Max({<Actual = {'*'}>}WE, 4)) & '<=' & Date(Max({<Actual = {'*'}>}WE)))"}>}Actual)/Sum(TOTAL {<WE = {"$(='>=' & Date(Max({<Actual = {'*'}>}WE, 4)) & '<=' & Date(Max({<Actual = {'*'}>}WE)))"}>}Curve))
- Mark as New
- Bookmark
- Subscribe
- Mute
- Subscribe to RSS Feed
- Permalink
- Report Inappropriate Content
Thank you! I didn't know you could do a sum outside the dimension. After seeing your solution, I found this link that explains it well: https://community.qlikview.com/thread/60299
I don't quite understand the statement inside the Total keyword. I get that it's limiting the range by the dates, but it's not obvious to me how to build a similar statement on my own. Do you have links that can help me self learn this?
I figured out a bunch of it, but specifically what I don't understand is this syntax:
{"$(=' conditionals ')"}
- Mark as New
- Bookmark
- Subscribe
- Mute
- Subscribe to RSS Feed
- Permalink
- Report Inappropriate Content
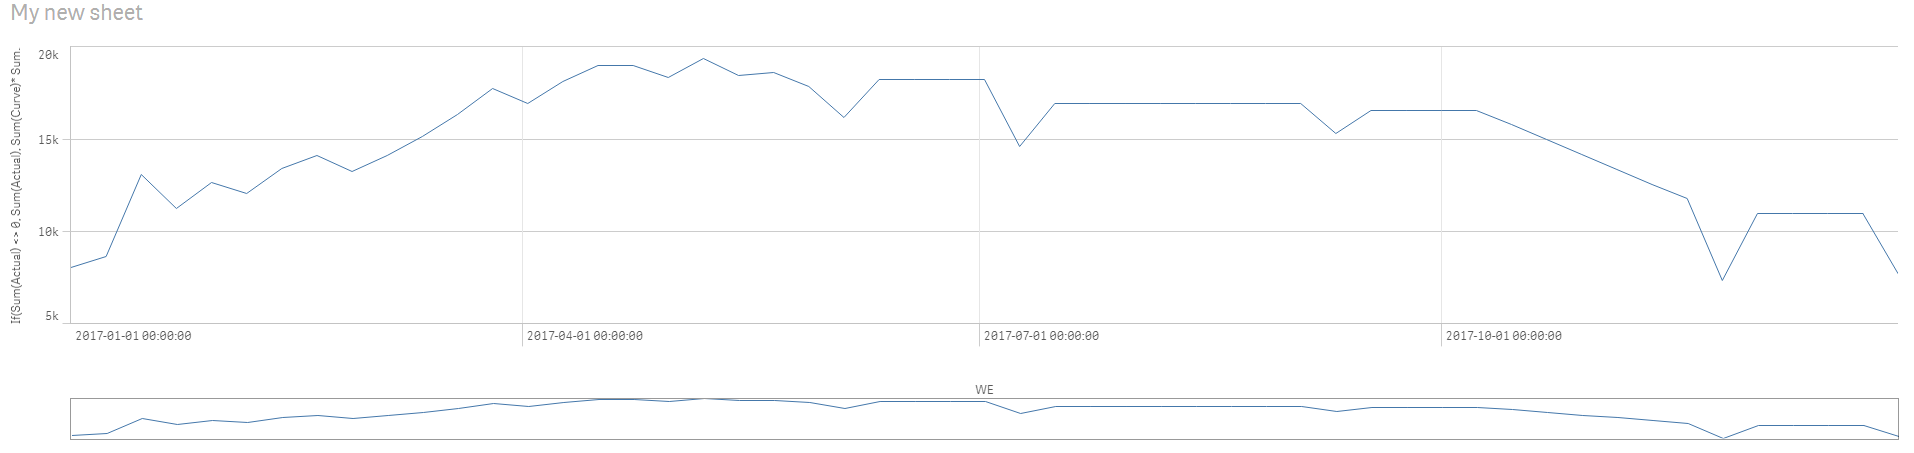
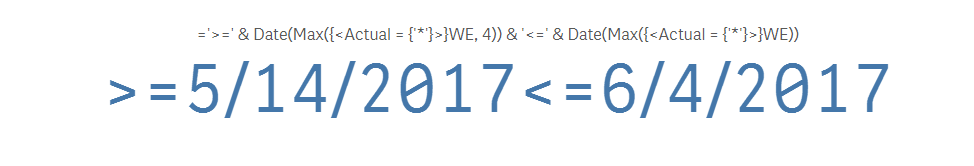
Since you only want the last four weeks data for the estimate purposes, I had to use set analysis to get the sum of actual for those periods. If you add the below to a KPI Object... you will see a range which would include the last 4 weeks of actuals and curve
='>=' & Date(Max({<Actual = {'*'}>}WE, 4)) & '<=' & Date(Max({<Actual = {'*'}>}WE))
- Mark as New
- Bookmark
- Subscribe
- Mute
- Subscribe to RSS Feed
- Permalink
- Report Inappropriate Content
Also, TOTAL has nothing to do the set analysis here... they are two separate things
- Mark as New
- Bookmark
- Subscribe
- Mute
- Subscribe to RSS Feed
- Permalink
- Report Inappropriate Content
I rewrote your formula to help me understand it, and it gave identical results:
Sum(TOTAL {<WE = {"$(='>=5/14/2017<=6/4/2017')"}>}Actual)
I understand how you used the date and max functions to create the conditional string. What I don't understand is how the syntax in general works, what does $ mean, etc.
- « Previous Replies
-
- 1
- 2
- Next Replies »