Unlock a world of possibilities! Login now and discover the exclusive benefits awaiting you.
- Qlik Community
- :
- Forums
- :
- Groups
- :
- Industry and Topics
- :
- Healthcare
- :
- Re: Set Analysis! What the heck am I doing wrong?
- Subscribe to RSS Feed
- Mark Topic as New
- Mark Topic as Read
- Float this Topic for Current User
- Bookmark
- Subscribe
- Mute
- Printer Friendly Page
- Feature this Topic
- Mark as New
- Bookmark
- Subscribe
- Mute
- Subscribe to RSS Feed
- Permalink
- Report Inappropriate Content
Set Analysis! What the heck am I doing wrong?
I'm at my wits end in trying to get this to work. My goal is to create a line chart (eventually a control chart) that is influenced by interventions that occur at various points along the dimension (Year Month). I have created a dedicated table for the control chart that is not joined to any other table in the script. I want to use set analysis to control what is seen, but I can't even get it to work for a simple numeric variable, let alone the date range I wish to apply.
The chart currently is showing the "Median" and I would like the following to be represented in the set analysis:
MeasureInterventionMeasureID = vMeasureID
MeasureInterventionYearMonth between vMeasureInterventionStartYearMonth and vMeasureInterventionEndYearMonth
The current expression in the chart works when I hard code a number for the measure ID, but my attempts at replacing it with the variable have failed.
I am attaching the app. Thanks ahead of time for any assistance. It is greatly appreciated!
- Tags:
- Group_Discussions
Accepted Solutions
- Mark as New
- Bookmark
- Subscribe
- Mute
- Subscribe to RSS Feed
- Permalink
- Report Inappropriate Content
Your MI_YearMonth is still not a date field... you need to use this
Interventions:
LOAD *,
Date#(MeasureInterventionYearMonth, 'YYYY-MM') AS MI_YearMonth
Resident Load_Interventions;
But just to show that this can work without fixing the date field, you can use this
=NUM(Only({<MeasureInterventionMeasureID = {$(=$(vMeasureID))},
MI_YearMonth = {"=Date#(MI_YearMonth, 'YYYY-MM') >= $(vMeasureInterventionStartYearMonth) and Date#(MI_YearMonth, 'YYYY-MM') <= $(vMeasureInterventionEndYearMonth)"}>} MeasureInterventionMedian),'#,##0.00%')
- Mark as New
- Bookmark
- Subscribe
- Mute
- Subscribe to RSS Feed
- Permalink
- Report Inappropriate Content
May be try this
=NUM(Only({<MeasureInterventionMeasureID = {$(=$(vMeasureID))}>} MeasureInterventionMedian),'#,##0.00%')
- Mark as New
- Bookmark
- Subscribe
- Mute
- Subscribe to RSS Feed
- Permalink
- Report Inappropriate Content
Thanks! That works for the first part. Now I need the statement for date range based on year, month.
MeasureInterventionYearMonth between vMeasureInterventionStartYearMonth and vMeasureInterventionEndYearMonth
- Mark as New
- Bookmark
- Subscribe
- Mute
- Subscribe to RSS Feed
- Permalink
- Report Inappropriate Content
Would this range differ based on dimension? or is this a single range across the chart?
- Mark as New
- Bookmark
- Subscribe
- Mute
- Subscribe to RSS Feed
- Permalink
- Report Inappropriate Content
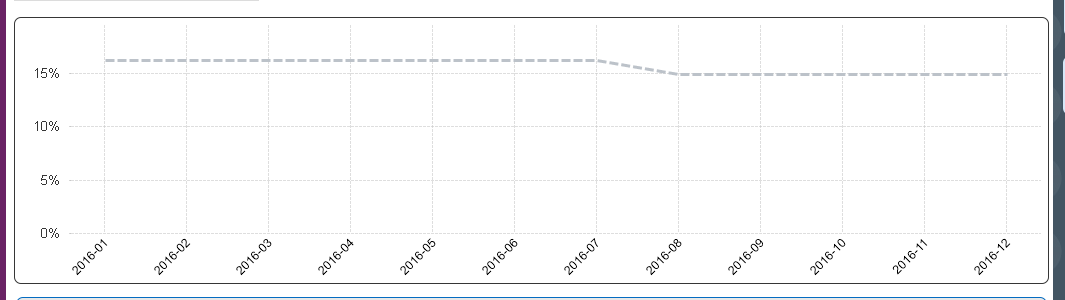
The dimension for the chart is YYYY-MM format. The two variables (Min & Max) of the date range established by date dimensions on the chart, formatted with the same YYYY-MM. To answer the question, it is a single range across the chart.
- Mark as New
- Bookmark
- Subscribe
- Mute
- Subscribe to RSS Feed
- Permalink
- Report Inappropriate Content
The MeasureInterventionYearMonth field is not read as date and you will have to fix this in the script to make it read as a date. Have a look at the following links
And this for set analysis
- Mark as New
- Bookmark
- Subscribe
- Mute
- Subscribe to RSS Feed
- Permalink
- Report Inappropriate Content
Hi Dan,
can I ask a couple of clarifiying questions?
It looks like you're dealing with data displayed as percentages - is that correct?
If so, what type of control chart are you hoping to use - because that will impact on the calculations for standard deviation.
Finally - when you say the chart "is influenced by interventions that occur at various points along the dimension" - does this mean you want the limits/centre line to rebase if specific signals occur (presumably as a result of some improvement activity)?
- Mark as New
- Bookmark
- Subscribe
- Mute
- Subscribe to RSS Feed
- Permalink
- Report Inappropriate Content
Most of the "Measure" will be percentages, however, we will have some also that will be volumes (Total Deliveries) and some that will be minutes (Length of Stay). I'm not so worried about the type of control chart at this moment, as my knowledge of them is very limited at this point. I am simply trying to get the "Median" to work with the proper set analysis.
Your second statement is true. As our quality groups implement "interventions" in an effort to improve a measure, I want the chart to shift starting at the beginning of the "intervention" to visually any change.
I am attaching a new copy of the app as I noticed the expressions for my date variables reverted back to a previous version.
- Mark as New
- Bookmark
- Subscribe
- Mute
- Subscribe to RSS Feed
- Permalink
- Report Inappropriate Content
Your MI_YearMonth is still not a date field... you need to use this
Interventions:
LOAD *,
Date#(MeasureInterventionYearMonth, 'YYYY-MM') AS MI_YearMonth
Resident Load_Interventions;
But just to show that this can work without fixing the date field, you can use this
=NUM(Only({<MeasureInterventionMeasureID = {$(=$(vMeasureID))},
MI_YearMonth = {"=Date#(MI_YearMonth, 'YYYY-MM') >= $(vMeasureInterventionStartYearMonth) and Date#(MI_YearMonth, 'YYYY-MM') <= $(vMeasureInterventionEndYearMonth)"}>} MeasureInterventionMedian),'#,##0.00%')
- Mark as New
- Bookmark
- Subscribe
- Mute
- Subscribe to RSS Feed
- Permalink
- Report Inappropriate Content
Thanks, Sunny! This is such an amazing resource made amazing by all of you MVPs who take the time to help a grunt like me.