Unlock a world of possibilities! Login now and discover the exclusive benefits awaiting you.
- Qlik Community
- :
- All Forums
- :
- QlikView App Dev
- :
- How to show these datapoints in the chart?
- Subscribe to RSS Feed
- Mark Topic as New
- Mark Topic as Read
- Float this Topic for Current User
- Bookmark
- Subscribe
- Mute
- Printer Friendly Page
- Mark as New
- Bookmark
- Subscribe
- Mute
- Subscribe to RSS Feed
- Permalink
- Report Inappropriate Content
How to show these datapoints in the chart?
Hi Experts,
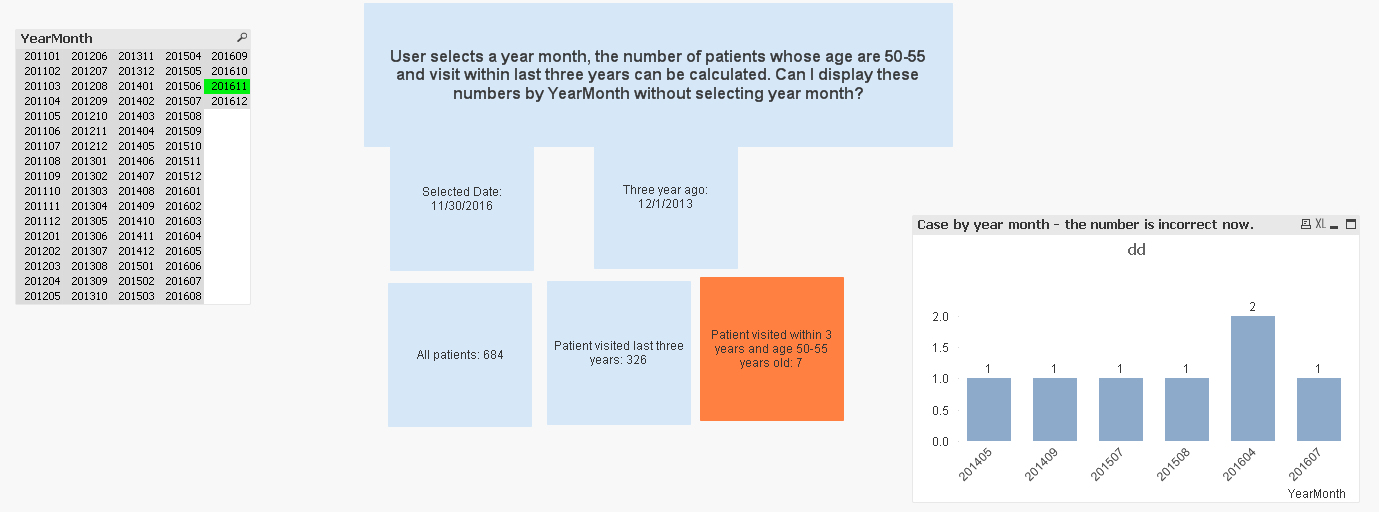
I can get patients number whose age is between 50 and 55 and visit our clinic in the last three years in given year month. Please refer to the sample app in the attachment. When a year and month is selected, the number of patients can be calculated. Right now I would like to show all the patient number by year month in the chart, how can I do it?
Please help.
Thanks
- Mark as New
- Bookmark
- Subscribe
- Mute
- Subscribe to RSS Feed
- Permalink
- Report Inappropriate Content
What do you mean when you say without selecting YearMonth? You would not want to select 201611 below and still see 7?
- Mark as New
- Bookmark
- Subscribe
- Mute
- Subscribe to RSS Feed
- Permalink
- Report Inappropriate Content
I would like to show the patient numbers by Yearmonth in order to show a trend. Right now user can get the patient number for specific 'Yearmonth' by selecting it. Is there any way to use YearMonth in the dimension instead of using the yearMonth in the listbox? Thanks
- Mark as New
- Bookmark
- Subscribe
- Mute
- Subscribe to RSS Feed
- Permalink
- Report Inappropriate Content
I am difficulty in understanding the final goal here....Are you looking for this -> without selecting a yearMonth, you would want to see all patients which were between 50 and 55? Have you envisioned how the output will look like?
- Mark as New
- Bookmark
- Subscribe
- Mute
- Subscribe to RSS Feed
- Permalink
- Report Inappropriate Content
Yes. Instead of showing only one patient number (whose age is 50-55 and has a visit in past three years) by user's selection, I would like to show the patient numbers for all the yearMonths. I would like show these data points either in bar chart or line chart. I am sorry about the confusion.