Unlock a world of possibilities! Login now and discover the exclusive benefits awaiting you.
- Qlik Community
- :
- Forums
- :
- Analytics
- :
- New to Qlik Analytics
- :
- Re: Rolling Sum
- Subscribe to RSS Feed
- Mark Topic as New
- Mark Topic as Read
- Float this Topic for Current User
- Bookmark
- Subscribe
- Mute
- Printer Friendly Page
- Mark as New
- Bookmark
- Subscribe
- Mute
- Subscribe to RSS Feed
- Permalink
- Report Inappropriate Content
Rolling Sum
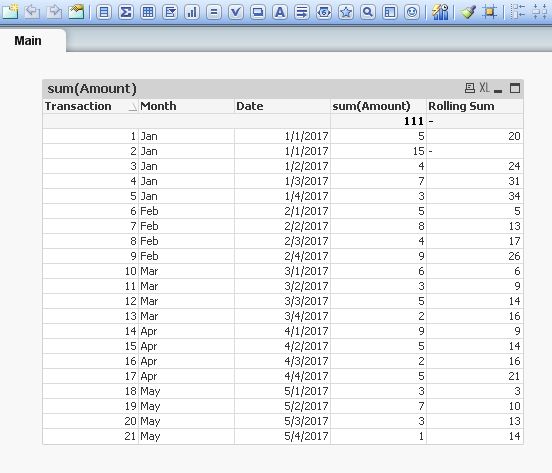
I would like to create a rolling sum to display in a bar graph. Currently, I have a Date and Amount. I would like to sum the data for that day and the previous 2 days to create a "Running total" for a day. For example, on May 4 the Running Total would be 11. On May 3rd, the running total would be 13. On May 2nd, the Running total would be 10, because there is no date on 4/30. I wasn't sure how to create this and whether the best way to do this would be to create some sort of new field in the load script or via set analysis. The attachment is simply the table displayed below in excel format. Thanks for the help!
| Transaction | Month | Date | Amount |
| 1 | Jan | 1/1/2017 | 5 |
| 2 | Jan | 1/1/2017 | 15 |
| 3 | Jan | 1/2/2017 | 4 |
| 4 | Jan | 1/3/2017 | 7 |
| 5 | Jan | 1/4/2017 | 3 |
| 6 | Feb | 2/1/2017 | 5 |
| 7 | Feb | 2/2/2017 | 8 |
| 8 | Feb | 2/3/2017 | 4 |
| 9 | Feb | 2/4/2017 | 9 |
| 10 | Mar | 3/1/2017 | 6 |
| 11 | Mar | 3/2/2017 | 3 |
| 12 | Mar | 3/3/2017 | 5 |
| 13 | Mar | 3/4/2017 | 2 |
| 14 | Apr | 4/1/2017 | 9 |
| 15 | Apr | 4/2/2017 | 5 |
| 16 | Apr | 4/3/2017 | 2 |
| 17 | Apr | 4/4/2017 | 5 |
| 18 | May | 5/1/2017 | 3 |
| 19 | May | 5/2/2017 | 7 |
| 20 | May | 5/3/2017 | 3 |
| 21 | May | 5/4/2017 | 1 |
Accepted Solutions
- Mark as New
- Bookmark
- Subscribe
- Mute
- Subscribe to RSS Feed
- Permalink
- Report Inappropriate Content
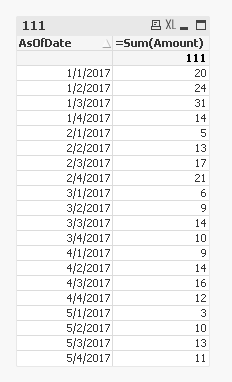
I suggest using The As-Of Table
Table:
LOAD Transaction,
Month,
Date,
Amount
FROM
[..\..\..\Downloads\Test Sum Load.xlsx]
(ooxml, embedded labels, table is Sheet1);
AsOfTable:
LOAD DISTINCT Date as AsOfDate,
Date(Date - IterNo() + 1) as Date
Resident Table
While IterNo() <= 3;
- Mark as New
- Bookmark
- Subscribe
- Mute
- Subscribe to RSS Feed
- Permalink
- Report Inappropriate Content
Hi,
Try like below,
Create expression in your chart.
Aggr(RangeSum(Above(Sum(Amount), 0, RowNo())), Month, Date)
Thanks,Deva
- Mark as New
- Bookmark
- Subscribe
- Mute
- Subscribe to RSS Feed
- Permalink
- Report Inappropriate Content
I suggest using The As-Of Table
Table:
LOAD Transaction,
Month,
Date,
Amount
FROM
[..\..\..\Downloads\Test Sum Load.xlsx]
(ooxml, embedded labels, table is Sheet1);
AsOfTable:
LOAD DISTINCT Date as AsOfDate,
Date(Date - IterNo() + 1) as Date
Resident Table
While IterNo() <= 3;
- Mark as New
- Bookmark
- Subscribe
- Mute
- Subscribe to RSS Feed
- Permalink
- Report Inappropriate Content
That works perfectly, thank you!