Unlock a world of possibilities! Login now and discover the exclusive benefits awaiting you.
- Qlik Community
- :
- Forums
- :
- Analytics
- :
- New to Qlik Analytics
- :
- Re: Totals on Pivot table are incorrect
- Subscribe to RSS Feed
- Mark Topic as New
- Mark Topic as Read
- Float this Topic for Current User
- Bookmark
- Subscribe
- Mute
- Printer Friendly Page
- Mark as New
- Bookmark
- Subscribe
- Mute
- Subscribe to RSS Feed
- Permalink
- Report Inappropriate Content
Totals on Pivot table are incorrect
The pivot table has 1 row, 2 columns and 1 measure. The row is School Building, the 2 columns are School Year and Therapy Type. The measure function looks like this:
count(distinct if ( (consult + individual + direct)>0,studentid))
the function counts the studentids who received Consult, Individual or Direct services
The totals by School Building are correct, but the grand totals are not.
Any help is surely appreciated.
Celia
- « Previous Replies
-
- 1
- 2
- Next Replies »
- Mark as New
- Bookmark
- Subscribe
- Mute
- Subscribe to RSS Feed
- Permalink
- Report Inappropriate Content
May be use Sum(Aggr())...
Sum(Aggr(Count(DISTINCT If((consult + individual + direct)>0, studentid)), Dimensions))
or this
Sum(Aggr(Count(DISTINCT {<studentid = {"=consult + individual + direct > 0"}>} studentid), Dimensions))
- Mark as New
- Bookmark
- Subscribe
- Mute
- Subscribe to RSS Feed
- Permalink
- Report Inappropriate Content
Hi,
Like this?
=count({$<consult={">0"},individual={">0"},direct={">0"}>} distinct studentid)
or
if(count(consult + individual + direct)>0,distinct count(studentid),0)
- Mark as New
- Bookmark
- Subscribe
- Mute
- Subscribe to RSS Feed
- Permalink
- Report Inappropriate Content
I will try you suggestions, but where do I enter this function to replace to "built-in" totals (the ones that are wrong on my pivot table)?
- Mark as New
- Bookmark
- Subscribe
- Mute
- Subscribe to RSS Feed
- Permalink
- Report Inappropriate Content
Hi,
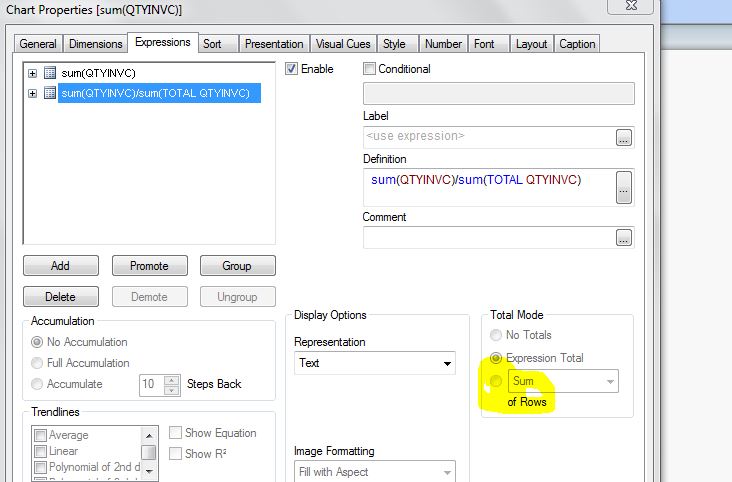
In your pivot chart --expression total mode change to "Sum of rows"
like this
- Mark as New
- Bookmark
- Subscribe
- Mute
- Subscribe to RSS Feed
- Permalink
- Report Inappropriate Content
I think this is Sense Devarasu
- Mark as New
- Bookmark
- Subscribe
- Mute
- Subscribe to RSS Feed
- Permalink
- Report Inappropriate Content
Just replace your existing expression with the new one
- Mark as New
- Bookmark
- Subscribe
- Mute
- Subscribe to RSS Feed
- Permalink
- Report Inappropriate Content
Hi,
Refer to the sense - in build total mode. and here you can write your custom total expression. still if you have issue then share with us your mock app. tks

- Mark as New
- Bookmark
- Subscribe
- Mute
- Subscribe to RSS Feed
- Permalink
- Report Inappropriate Content
I use Qlik Sense Cloud. How do I get to the Chart Properties Window in Davarasu's reply above?
- Mark as New
- Bookmark
- Subscribe
- Mute
- Subscribe to RSS Feed
- Permalink
- Report Inappropriate Content
I should say that I don't have access to an "Expressions" tab.
- « Previous Replies
-
- 1
- 2
- Next Replies »