Unlock a world of possibilities! Login now and discover the exclusive benefits awaiting you.
- Qlik Community
- :
- Forums
- :
- Analytics
- :
- App Development
- :
- I would like to 'repeat' the contents of an App Sh...
- Subscribe to RSS Feed
- Mark Topic as New
- Mark Topic as Read
- Float this Topic for Current User
- Bookmark
- Subscribe
- Mute
- Printer Friendly Page
- Mark as New
- Bookmark
- Subscribe
- Mute
- Subscribe to RSS Feed
- Permalink
- Report Inappropriate Content
I would like to 'repeat' the contents of an App Sheet n times for n items
E.g. if I have 1000 products and I pick 10 (as a filter)
I would like e.g. some pie charts and a little table to appear for each of those 10
I've seen similar things in Oracle BI in the past. It would be useful here
E.g. a tree-map of customers against order volume for 'each' of your top 10 products
I know a little of Qlik Sense now, but am still relatively beginner. I've not seen anything like this
Accepted Solutions
- Mark as New
- Bookmark
- Subscribe
- Mute
- Subscribe to RSS Feed
- Permalink
- Report Inappropriate Content
To Trellis in Qlik Sense, you'll need to use an extension. Check this one out
-Rob
- Mark as New
- Bookmark
- Subscribe
- Mute
- Subscribe to RSS Feed
- Permalink
- Report Inappropriate Content
Hi Tom,
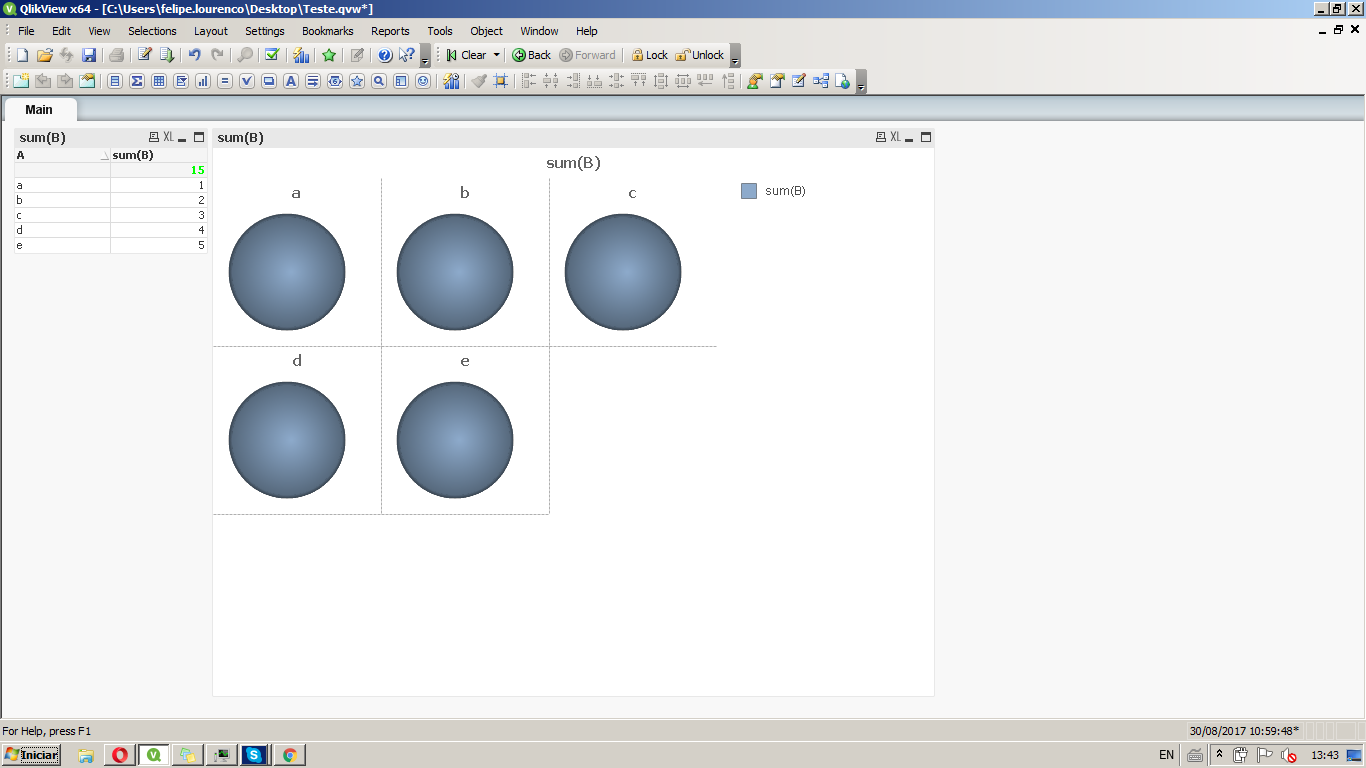
You can do something similar to what you want with Trellis option in pie chart.
http://help.qlik.com/en-US/qlikview/12.1/Subsystems/Client/Content/Trellis_Settings.htm
As an example I have this based on A field (without selection),
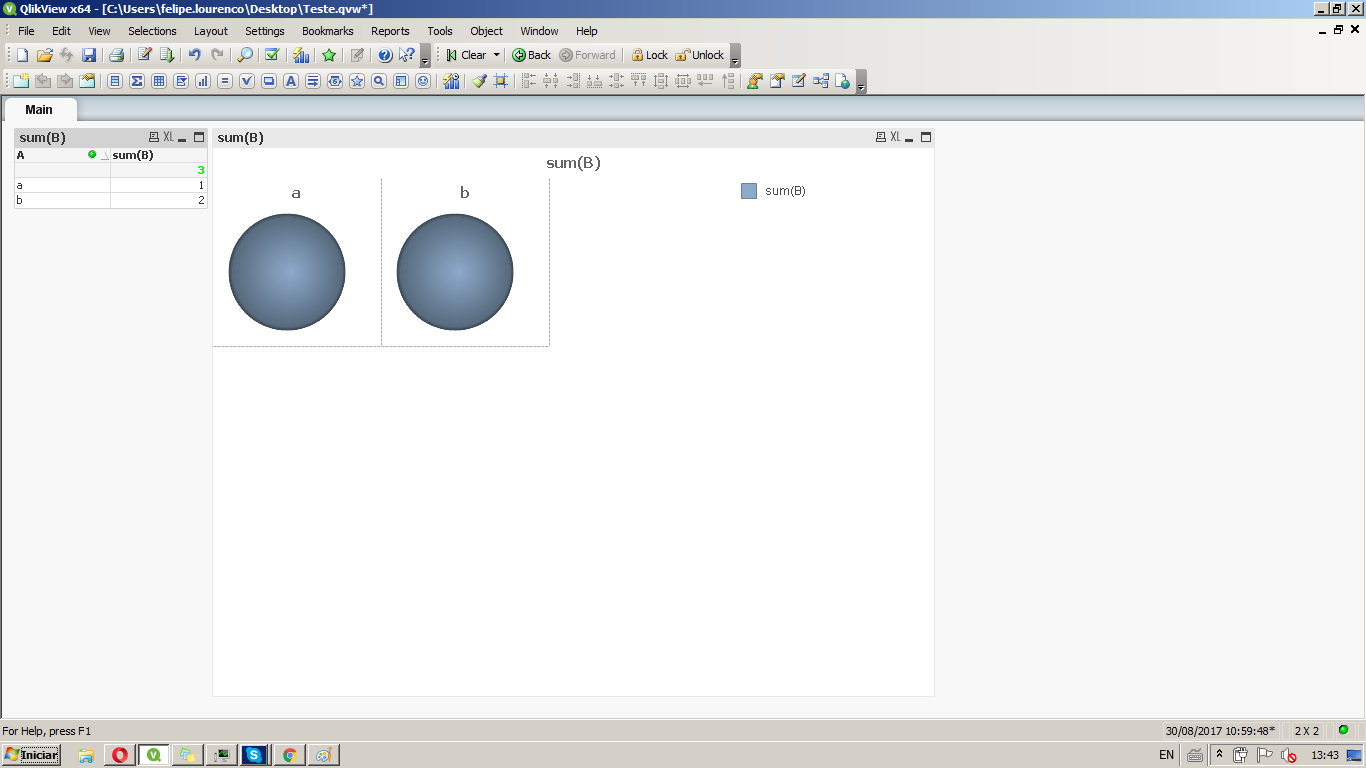
And when I select 2 of them, i get the following:
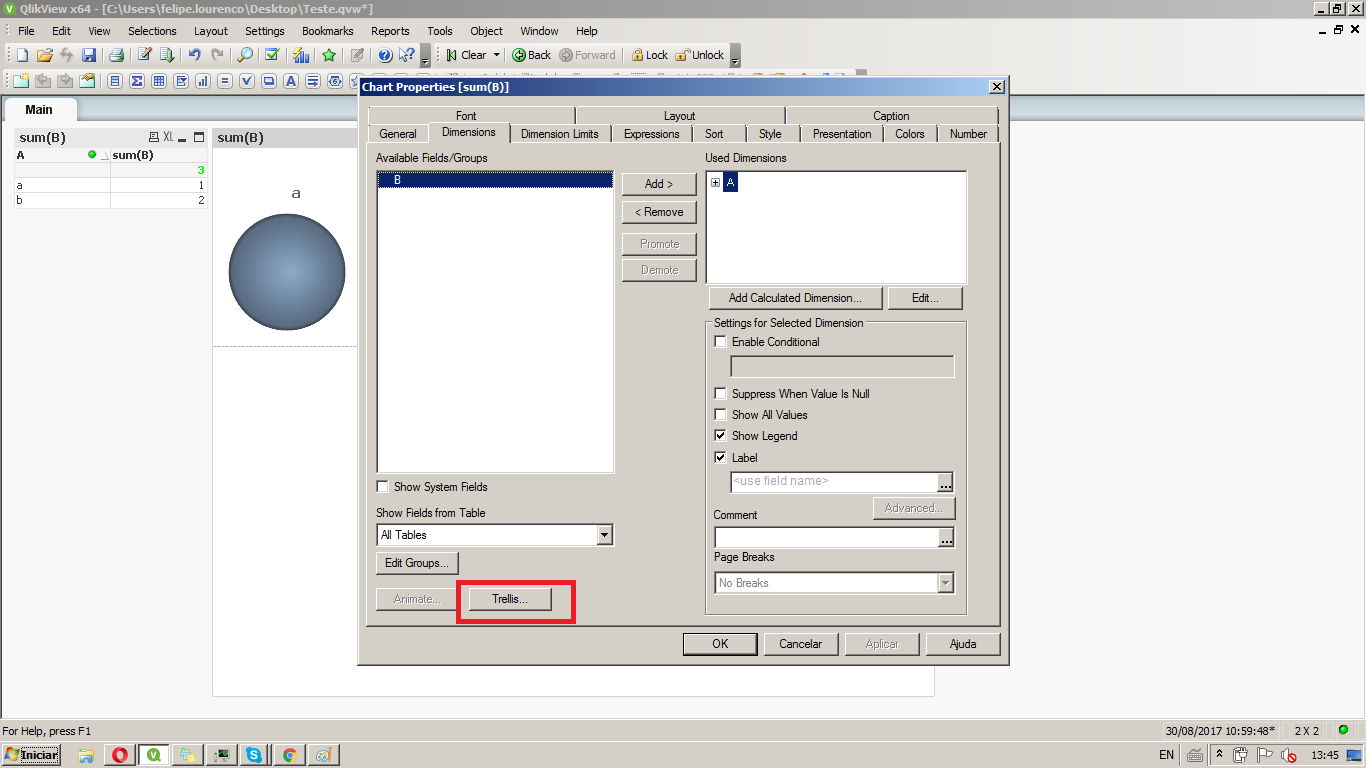
The Trellis option is on the Dimension tab, as shown bellow
- Mark as New
- Bookmark
- Subscribe
- Mute
- Subscribe to RSS Feed
- Permalink
- Report Inappropriate Content
- Mark as New
- Bookmark
- Subscribe
- Mute
- Subscribe to RSS Feed
- Permalink
- Report Inappropriate Content
Thanks, I should have relly been more specific, I was actually using treemaps, I'm not sure it has the feature.
At least there seems no generalised solution. Thanks for that advice. Good to know about pie-charts.
- Mark as New
- Bookmark
- Subscribe
- Mute
- Subscribe to RSS Feed
- Permalink
- Report Inappropriate Content
Thanks, I was really using Treemaps. I should have just stateed that rather than naming pie-charts.
- Mark as New
- Bookmark
- Subscribe
- Mute
- Subscribe to RSS Feed
- Permalink
- Report Inappropriate Content
Sorry replied to wrong message previously. That sounds really good, thanks.
Trellis.
Cool. Thankyou.
- Mark as New
- Bookmark
- Subscribe
- Mute
- Subscribe to RSS Feed
- Permalink
- Report Inappropriate Content
I always forget to check if its on the Qlik Sense or View section of the community and end up assuming its View.
Nice extension.