Unlock a world of possibilities! Login now and discover the exclusive benefits awaiting you.
- Qlik Community
- :
- Forums
- :
- Analytics
- :
- New to Qlik Analytics
- :
- Re: Need to group by age ?
- Subscribe to RSS Feed
- Mark Topic as New
- Mark Topic as Read
- Float this Topic for Current User
- Bookmark
- Subscribe
- Mute
- Printer Friendly Page
- Mark as New
- Bookmark
- Subscribe
- Mute
- Subscribe to RSS Feed
- Permalink
- Report Inappropriate Content
Need to group by age ?
In my data, I have only year of birth. So I used =Age(Today(), MakeDate(YearofBirth)) function to have Age in my dimension. Now, I need to group them in X-axis. Like from age 20-25, 25-30,30-40, above 40 years. In my measure I have employee count (Y-axis). How do I do it.
- Tags:
- grouping data
- Mark as New
- Bookmark
- Subscribe
- Mute
- Subscribe to RSS Feed
- Permalink
- Report Inappropriate Content
Hi,
Try to create logical column at back end script like below,
Load *,
if(Age >=20 and Age<25,Dual('20-25 Years',1),
if(Age >=25 and Age<30,Dual('25-30 Years',2),
if(Age >=30 and Age<=40,Dual('30-40 Years',3),Dual('Above 40 Years',4) as AgeBucket;
load *
from table;
also check this article
Thanks,
Deva
- Mark as New
- Bookmark
- Subscribe
- Mute
- Subscribe to RSS Feed
- Permalink
- Report Inappropriate Content
Thanks for the reply. Since there is no age column. I tried to load Age from Date of Birth using
LOAD Age(Today(), MakeDate(YearofBirth)) as Avg_Age;
SQL SELECT YearofBirth
FROM dbo.Employee;
So when I try to add ur code. It says ,"
The following error occurred:
Field 'Age' not found "
- Mark as New
- Bookmark
- Subscribe
- Mute
- Subscribe to RSS Feed
- Permalink
- Report Inappropriate Content
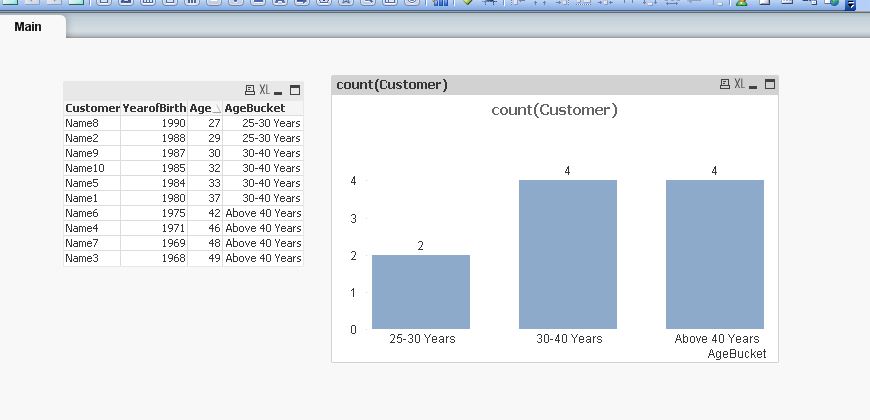
Hi,
like this?
Data:
Load *,
if(Age >=20 and Age<25,Dual('20-25 Years',1),
if(Age >=25 and Age<30,Dual('25-30 Years',2),
if(Age >=30 and Age<=40,Dual('30-40 Years',3),Dual('Above 40 Years',4) ))) as AgeBucket;
load *, Age(Today(), MakeDate(YearofBirth)) as Age;
LOAD * INLINE [
Customer, YearofBirth
Name1, 1980
Name2, 1988
Name3, 1968
Name4, 1971
Name5, 1984
Name6, 1975
Name7, 1969
Name8, 1990
Name9, 1987
Name10,1985
];
- Mark as New
- Bookmark
- Subscribe
- Mute
- Subscribe to RSS Feed
- Permalink
- Report Inappropriate Content
Hi,
if your question answered, help to close this thread by marking correct. Thanks
Regards,Deva