Unlock a world of possibilities! Login now and discover the exclusive benefits awaiting you.
- Qlik Community
- :
- Forums
- :
- Analytics
- :
- New to Qlik Analytics
- :
- Re: How to calculate the percentage of counts base...
- Subscribe to RSS Feed
- Mark Topic as New
- Mark Topic as Read
- Float this Topic for Current User
- Bookmark
- Subscribe
- Mute
- Printer Friendly Page
- Mark as New
- Bookmark
- Subscribe
- Mute
- Subscribe to RSS Feed
- Permalink
- Report Inappropriate Content
How to calculate the percentage of counts based on a sub total
Hi
This is very frustrating as a 30 second job in excel and a 2 minute job in Tableau has taken up a couple of hours of my time in Qliksense and I am still no closer to a solution.
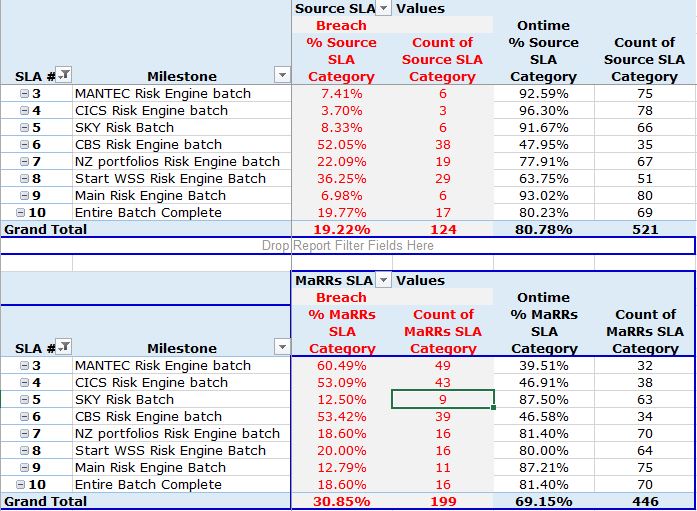
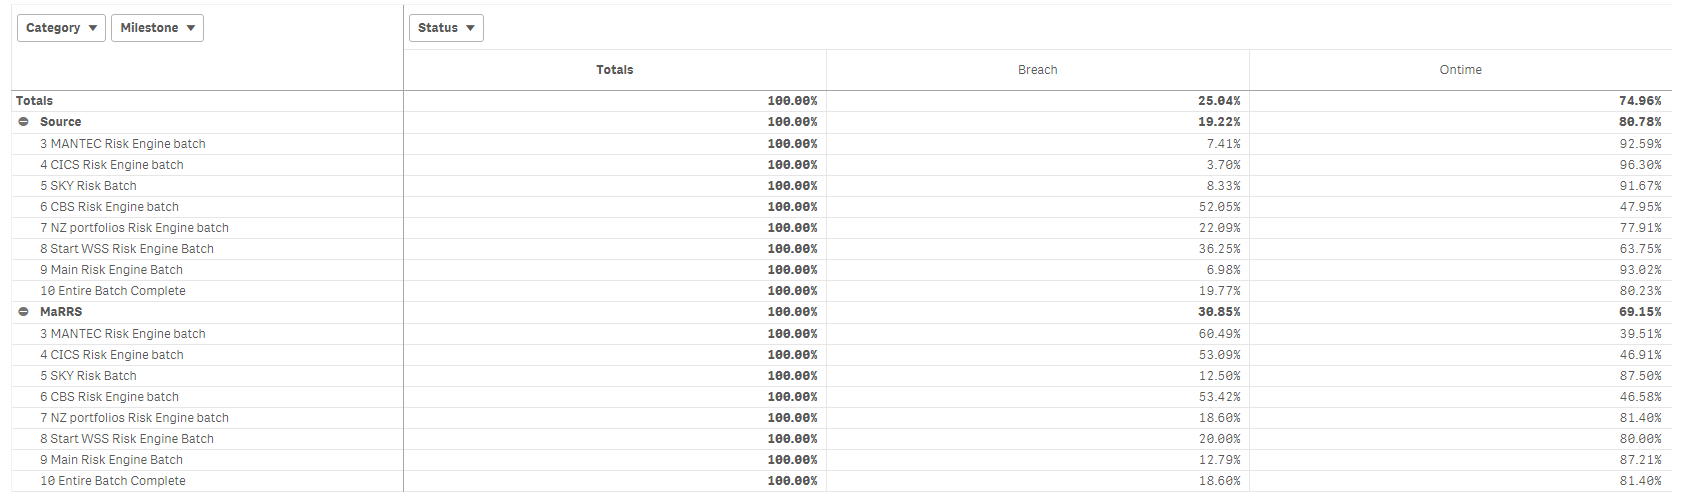
All I want is the % of each type of SLA (Milestone), ie. Source and MaRRS (Reporting tool) that has breached an SLA based on the sub total, for example SLA 10 breach 17/124 = 19.77%. Refer attached
I have tried various different methods for just the denominator before I get to the percentage calc such as aggr and Total and Nodistinct but cannot get any closer to a solution, eg.
- aggr ( Sum ( TOTAL count({1<Status=-{'N/A'}>}Status)) Milestone, Category) = No Values
- count(TOTAL {1<Status=-{'N/A'}>}Status) = 1,290 which is wrong (124 + 521 + 199 +446)
How this cannot be out of the box functionality given we are meant to role this out within our organisation as a self service model is beyond me.
Anyway, any help would be greatly appreciated.
- Mark as New
- Bookmark
- Subscribe
- Mute
- Subscribe to RSS Feed
- Permalink
- Report Inappropriate Content
But the image isn't what you wanted to get?
I also attached the qvf file back... did you look at that?
- Mark as New
- Bookmark
- Subscribe
- Mute
- Subscribe to RSS Feed
- Permalink
- Report Inappropriate Content
Sorry missed your file. When I opened up the file I don't get the 19.77% just blank fields, not only that the measure comes as a column not a measure.
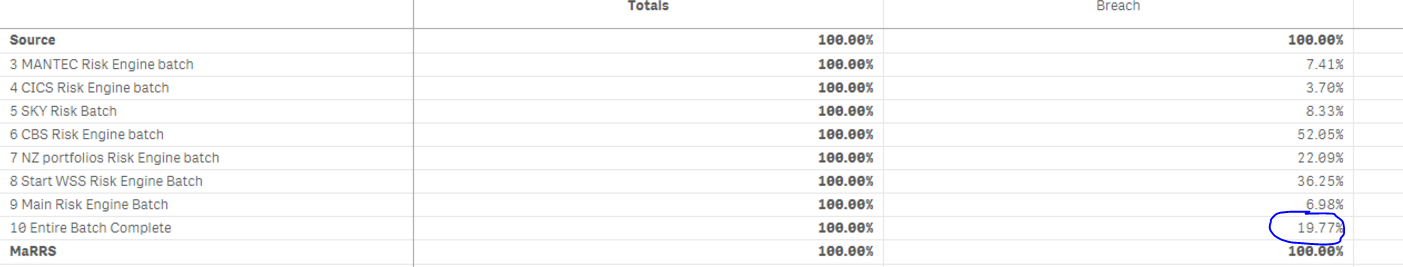
Anyway, your representation above while showing the correct % for the SLA now has the Category at 100% instead of 19.22%, ie. 124/645.
All i need is to divide the Category or the Milestone count based on the row total which is so easy in excel like below.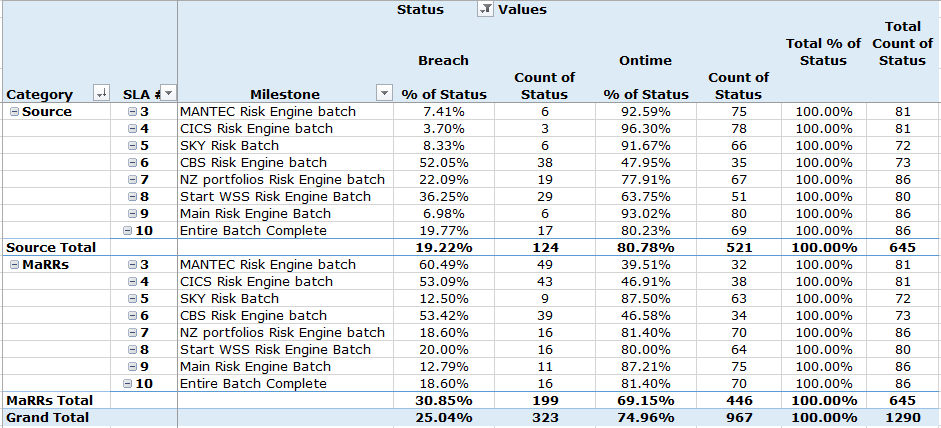 .
.
- Mark as New
- Bookmark
- Subscribe
- Mute
- Subscribe to RSS Feed
- Permalink
- Report Inappropriate Content
Try this
count({1<Status-={'N/A'}>}Status)/Sum({1}Aggr(Only({1} Aggr(NODISTINCT Count({1<Status-={'N/A'}>}Status), Category, Milestone)), Category, Milestone, Status))
- Mark as New
- Bookmark
- Subscribe
- Mute
- Subscribe to RSS Feed
- Permalink
- Report Inappropriate Content
I am nearly there, now I just need some help on my if statement.
Expressions
- count({1<Status=-{'N/A'}>}Status)/aggr (NODISTINCT count({1<Status=-{'N/A'}>}Status), Category) gives me the percentage at the Category level and
- count({1}Status)/aggr(NODISTINCT count(Status),Category, Milestone) gives me the percentage at the SLA level.
My issue now is how do I get the if statement to return values based on the field/dimension as the below still only provides the first expression not the second in the column of values.
If(Match(Category,'Source','MaRRs'),
count({1<Status=-{'N/A'}>}Status)/aggr (NODISTINCT count({1<Status=-{'N/A'}>}Status), Category), //Category %
count({1}Status) / aggr(NODISTINCT count(Status),Category, Milestone)) //SLA %
- Mark as New
- Bookmark
- Subscribe
- Mute
- Subscribe to RSS Feed
- Permalink
- Report Inappropriate Content
Hi
Yours is more cleaner than mine and almost does the job.
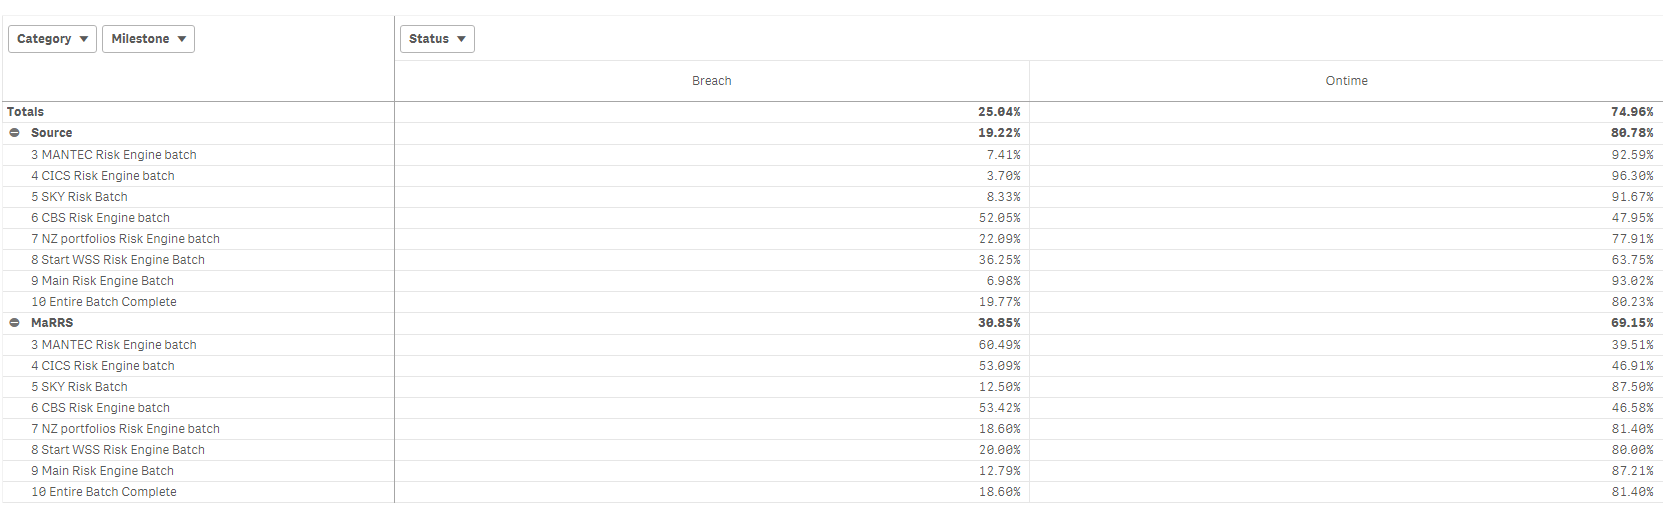
If I click on Columns, Status and Show totals to on, the Totals only show 50% even though the percentages generate total 100%.
Cheers
Cameron
- Mark as New
- Bookmark
- Subscribe
- Mute
- Subscribe to RSS Feed
- Permalink
- Report Inappropriate Content
I think that this number will always be 100%, right... try this
If(SecondaryDimensionality() = 0, count({1<Status-={'N/A'}>}Status)/count({1<Status-={'N/A'}>}Status), count({1<Status-={'N/A'}>}Status)/Sum({1}Aggr(Only({1} Aggr(NODISTINCT Count({1<Status-={'N/A'}>}Status), Category, Milestone)), Category, Milestone, Status)))
- Mark as New
- Bookmark
- Subscribe
- Mute
- Subscribe to RSS Feed
- Permalink
- Report Inappropriate Content
Thank you very much, I had briefly read about secondary dimensionality and only() today. Will need to do more study on this.
- Mark as New
- Bookmark
- Subscribe
- Mute
- Subscribe to RSS Feed
- Permalink
- Report Inappropriate Content
I would also suggest to upgrade your Qlik Sense to newer version, because this expression is much better than
Count({1<Status-={'N/A'}>}Status)
/
Count(TOTAL <Category, Milestone> {1<Status-={'N/A'}>}Status)
the one we used above..... and this worked with Sept 2017 release for me at work... but did not work at home.... so to me it seems like a bug in one of the releases which might have resolved in Sept 2017....
- Mark as New
- Bookmark
- Subscribe
- Mute
- Subscribe to RSS Feed
- Permalink
- Report Inappropriate Content
I initially used the simple one but with no luck so will now look at upgrading. thanks again.
- Mark as New
- Bookmark
- Subscribe
- Mute
- Subscribe to RSS Feed
- Permalink
- Report Inappropriate Content
I have just done the upgrade and Sunny you are correct, the simple formula works now.