Unlock a world of possibilities! Login now and discover the exclusive benefits awaiting you.
- Qlik Community
- :
- Forums
- :
- Analytics
- :
- New to Qlik Analytics
- :
- Re: Previous Quarter Growth
- Subscribe to RSS Feed
- Mark Topic as New
- Mark Topic as Read
- Float this Topic for Current User
- Bookmark
- Subscribe
- Mute
- Printer Friendly Page
- Mark as New
- Bookmark
- Subscribe
- Mute
- Subscribe to RSS Feed
- Permalink
- Report Inappropriate Content
Previous Quarter Growth
Hi,
i'm new to qliksense and i'm currently having trouble calculating previous quarter growth in a graph.
I'm using a Combo Chart, with the sales by quarter.
In the database i only have the quarter with the following format "2017 Q2".
How can i create the growth in the graph?
I was using this formula "(Sum(PerIodo)/sum({<PerIodo={"left(PerIodo,4)-1,' ',right(PerIodo,3))"}>}Quantia))-1" but it is not working.
I also read in the forums to use As-Of table but from what i was able to understand it needs to have the date (DD/MM/YYYY).
That information i don't have.
Can anybody give me a hand?
Thanks in advance.
- Mark as New
- Bookmark
- Subscribe
- Mute
- Subscribe to RSS Feed
- Permalink
- Report Inappropriate Content
if you have "date" field
Try this in editor
Table:
LOAD .......,
.......,
Date,
Dual('Q' & Ceil(Month(Date)/3) & Year(Date), QuarterStart(Date)) as quart
FROM...............................
;
...
in the table or chart
sum({$<quart={$(=ONLY(quart)-1)}>} Sales)
- Mark as New
- Bookmark
- Subscribe
- Mute
- Subscribe to RSS Feed
- Permalink
- Report Inappropriate Content
I haven't got any date field, hence the problem.
The only field i have is Quarter --> "2017 Q2"
- Mark as New
- Bookmark
- Subscribe
- Mute
- Subscribe to RSS Feed
- Permalink
- Report Inappropriate Content
Check this out.
(Pls ignore the two variables, I am not using them at all. They are for helping another person, not for this case.)
- Mark as New
- Bookmark
- Subscribe
- Mute
- Subscribe to RSS Feed
- Permalink
- Report Inappropriate Content
Hi Fei Xu,
first of all thanks for your reply.
From what i understood you loaded the information (sales and quarter) in the script.
The thing is my dataset has currently 173.111 lines ranging from 2015 Q1 to 2017 Q2.
Am i understanding correctly?
Also i wanted the Previous Year Growth and not previous period growth.
Thanks in advance.
- Mark as New
- Bookmark
- Subscribe
- Mute
- Subscribe to RSS Feed
- Permalink
- Report Inappropriate Content
I can't get where do you find this troubelsome?
You can just have your Qarter field as a dimension, and as a measure having 2 measures:
- sum(expression)
- (sum(expr)-above(sum(expr)))/ above(sum(expr)) and format it as % (secondary axis)
You'll have your graphic as follow:
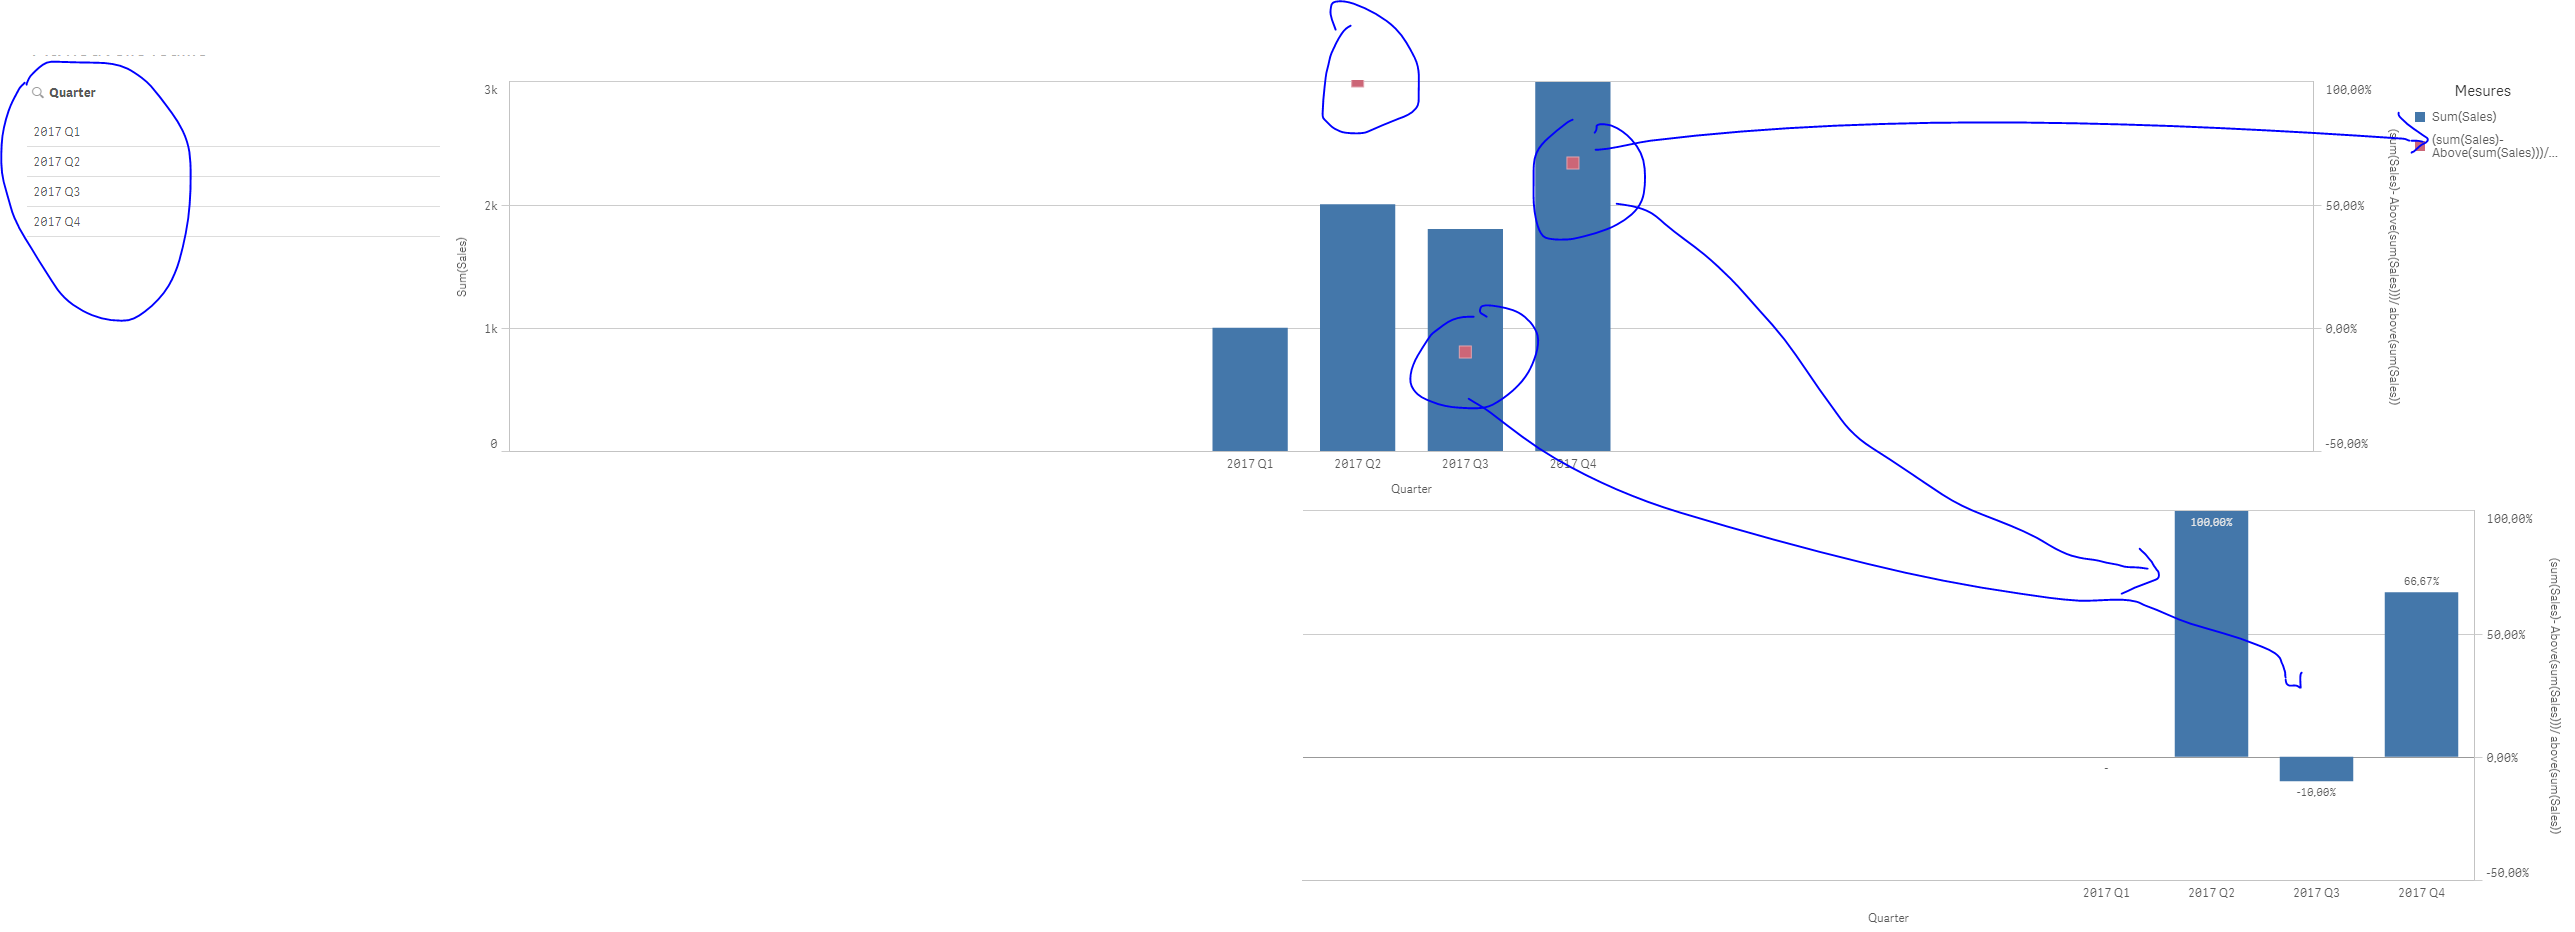
see the attached app !
- Mark as New
- Bookmark
- Subscribe
- Mute
- Subscribe to RSS Feed
- Permalink
- Report Inappropriate Content
Hi Omar thanks for the reply,
but i don't want Previous period growth but previous year growth.
I want to have (2017 Q2 / 2016 Q2) -1 (PYG)
Is it possible?
- Mark as New
- Bookmark
- Subscribe
- Mute
- Subscribe to RSS Feed
- Permalink
- Report Inappropriate Content
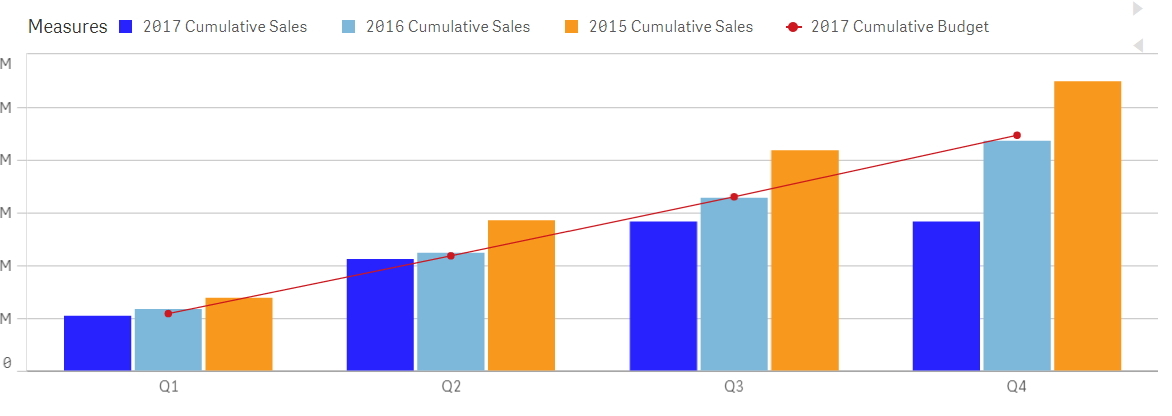
I am not sure if this is the result that you were looking for? Comparing previous year by quarter?
- Mark as New
- Bookmark
- Subscribe
- Mute
- Subscribe to RSS Feed
- Permalink
- Report Inappropriate Content
Hi Jason,
thanks for the reply.
What i want to have is for each quarter a bar chart with the sales of the quarter (axis1) and a line / symbol with the previous year growth for that quarter (axis2).
The previous year growth would be calculated with = (QTR 1 YEAR 1 / QTR 1 YEAR - 1)-1
The thing is in my current datased i only have QTR as a time dimension, no date, hence the problem.
- Mark as New
- Bookmark
- Subscribe
- Mute
- Subscribe to RSS Feed
- Permalink
- Report Inappropriate Content
Try again the new test file?